March same-store salesincreased 2.9% year-over-year
The average price paid for the top 500 items in March increased 1.4% year-over-year
NEWARK, N.J., April 06, 2026 (GLOBE NEWSWIRE) — NRSInsights, a provider of sales data and analytics drawn from retail transactions processed through the National Retail Solutions (NRS) point-of-sale (POS) platform, today announced comparative retail same-store sales results for March 2026.
As of March 31, 2026, the NRS retail network comprised approximately 39,100 active terminals nationwide, scanning purchases at approximately 33,800 independent retailers, including convenience stores, bodegas, liquor stores, grocers, and tobacco and sundries sellers, predominantly serving urban consumers.
March Highlights
(Same-store sales, unit sales, transactions, and average price data refer to March 2026 and are compared to March 2025 unless otherwise noted. All comparisons are provided on a “per calendar day” basis to remove from consideration variability in the number of days per month or three-month period.)
- SALES
- Same-store sales increased 2.9% year-over-year. In the previous month (February 2026), same-store sales increased 4.0% year-over-year.
- Same-store sales increased 4.3% compared to the previous month (February 2026). Same-store sales in February 2026 increased 4.4% compared to the previous month (January 2026).
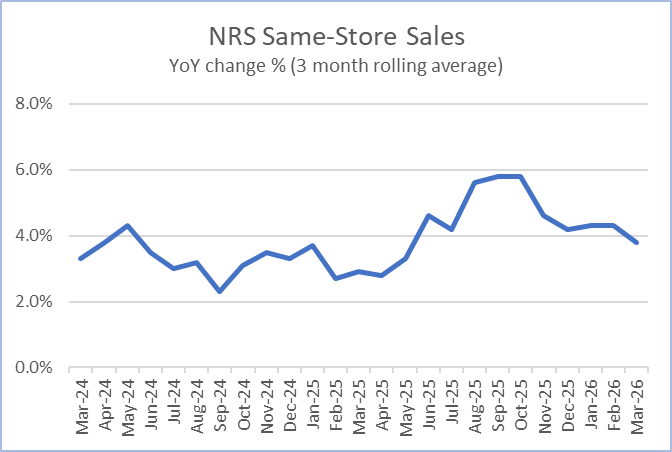
- For the three months ended March 31, 2026, same-store sales increased 3.8% compared to the corresponding three months a year ago.
- UNITS SOLD
- Units sold decreased 1.2% year-over-year. In the previous month (February 2026), units sold decreased 0.2% year-over-year.
- Units sold increased 4.0% compared to the previous month (February 2025). Units sold in February 2025 increased 2.1% compared to the previous month (January 2026).
- BASKETS (TRANSACTIONS) PER STORE
- Baskets decreased 0.4% year-over-year. In the previous month (February 2026), baskets decreased 0.8% year-over-year.
- Baskets increased 6.5% compared to the previous month (February 2026). Baskets in February 2026 increased 3.7% compared to the previous month (January 2026).
- AVERAGE PRICES
- A dollar-weighted average of prices for the top 500 items purchased in March 2026 increased 1.4% year-over-year, less than the 2.7% year-over-year increase in February 2026.
Commentary from Brandon Thurber (VP, Data Sales & Client Success at NRS)
“March same-store sales increased 2.9% year-over-year, a decrease from the 4.0% growth rate recorded in February. Transactions and units both declined slightly compared to a year ago.
“Category performance painted a telling picture as the convenience store channel likely benefited from budget-conscious consumers who traded down from restaurant, bar and other on-premise food and beverage service.
“Prepared cocktails and packaged espresso each posted year-over-year gains north of 34% in March, while sparkling water, coconut water, and frozen novelty all grew more than 17%. Smokeless tobacco, energy beverages, and rolling papers also continued their steady climbs.
“Regionally, Raleigh-Durham stood out with 10% year-over-year dollar growth, and Boston and San Francisco each posted gains of 4.5% or more. New York – our largest market by store count – was essentially flat on dollars while transactions fell 3.3%. Miami and Houston both registered smaller decreases.
“Inflation eased, with the dollar-weighted average price for the top 500 items in March rising 1.4% year over year — down from 2.7% in February and the lowest rate of increase we have seen in nearly two years.
“As we head into the second quarter, recent trends, including the consecutive year-over-year decreases in transactions counts, the strong gains in certain ‘down-trading’ categories, and moderating price increases suggest that macro-economic uncertainty may have begun to weigh on discretionary spending.”
NRSInsights Reports
The NRSInsights monthly Retail Same-Store Sales Reports are intended to provide timely topline data reflective of sales at NRS’ network of independent, predominantly urban, retail stores.
Same-store data comparisons of March 2026 with March 2025 are derived from approximately 232 million transactions processed through the approximately 25,000 stores on the NRS network that scanned transactions in both months. Same-store data comparisons of March 2026 with February 2026 are derived from approximately 261 million transactions processed through approximately 32,700 stores.
Same-store data comparisons for the three months ended March 31, 2026 with the year-ago three months are derived from approximately 618 million transactions processed through those stores that scanned transactions in both three-month periods.
NRS POS Platform
The NRS platform predominantly serves small-format, independent, retail stores nationwide including convenience stores, bodegas, liquor stores, grocers, and tobacco and sundries sellers. These independent retailers operate in all 50 states and the District of Colombia, including 206 of the 210 designated market areas (DMAs) in the United States, and in Canada. During March 2026, NRS’ POS terminals processed $2.2 billion in sales (+8% year-over-year) across 145 million transactions.
About National Retail Solutions (NRS):
National Retail Solutions operates a leading point-of-sale (POS) terminal-based platform and digital payment processing service for independent retailers nationwide. Retailers utilize NRS offerings to process transactions, effectively manage their businesses, and integrate with leading online order and delivery platforms. Consumer packaged goods (CPG) suppliers, brokers, analytics firms, and advertisers access the terminal’s digital display network to reach these retailers’ predominantly urban, multi-cultural shopper base, and to harness transaction data-based learnings to identify growth opportunities and measure both execution and returns on marketing investment. NRS is a subsidiary of IDT Corporation (NYSE: IDT).
All statements above that are not purely about historical facts, including, but not limited to, those in which we use the words “believe,” “anticipate,” “expect,” “plan,” “intend,” “estimate,” “target” and similar expressions, are forward-looking statements within the meaning of the Private Securities Litigation Reform Act of 1995. While these forward-looking statements represent our current judgment of what may happen in the future, actual results may differ materially from the results expressed or implied by these statements due to numerous important factors. Our filings with the SEC provide detailed information on such statements and risks, and should be consulted along with this release. To the extent permitted under applicable law, IDT assumes no obligation to update any forward-looking statements.
NRSInsights Contact:
Brandon Thurber
VP, Data Sales & Client Success at NRS
National Retail Solutions
Brandon.Thurber@nrsplus.com
IDT Corporation Contact:
Bill Ulrey
william.ulrey@idt.net
# # #
Attachment