Market Summary –
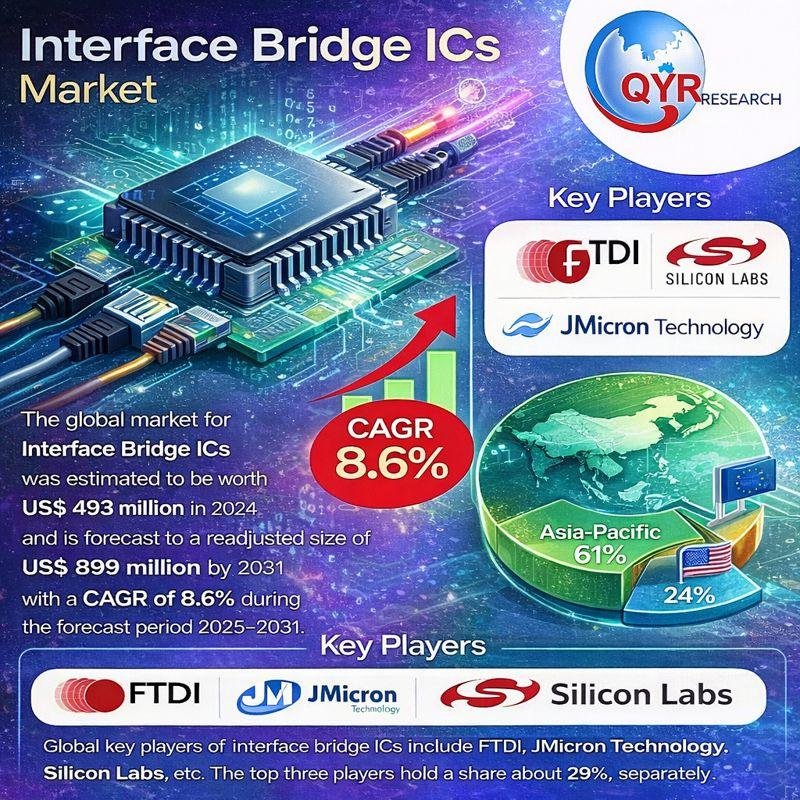
The global market for Interface Bridge ICs was estimated to be worth US$ 493 million in 2024 and is forecast to reach a readjusted size of US$ 899 million by 2031, expanding at a CAGR of 8.6% during the forecast period 2025-2031.
According to QY Research, the newly released report titled “Interface Bridge ICs Market Share and Ranking, Overall Sales and Demand Forecast 2025-2031” delivers a comprehensive, data-driven assessment of the global interface bridge ICs market. The study provides detailed insights into market size evolution, pricing trends, competitive structure, regional demand patterns, and future growth opportunities for semiconductor manufacturers, system designers, and technology investors.
Get Full PDF Sample Copy of the Report (Including Full TOC, Tables & Charts):
https://www.qyresearch.in/request-sample/electronics-semiconductor-interface-bridge-ics-market-share-and-ranking-overall-sales-and-demand-forecast-2025-2031
Trade Policy Impact and Supply Chain Assessment –
The potential shifts in the 2025 U.S. tariff framework pose substantial volatility risks to the global Interface Bridge ICs market. This report provides a comprehensive evaluation of recent tariff adjustments and international strategic countermeasures affecting cross-border semiconductor manufacturing, backend assembly, and global electronics supply chains.
The analysis covers impacts on production localization strategies, capital investment decisions, regional trade dependencies, and supply chain restructuring. Given the high global interdependence of semiconductor design, wafer fabrication, packaging, and distribution, this assessment enables stakeholders to anticipate policy risks and optimize sourcing and manufacturing strategies in an increasingly complex trade environment.
Product Definition and Technology Overview –
Interface Bridge ICs are semiconductor chips designed to enable data and signal conversion between different communication interfaces. These ICs support bridging from USB to UART, I2C, SPI, SATA, PCIe, and UFS, as well as conversions between PCIe and SATA and other high-speed interfaces.
They play a critical role in ensuring interoperability between disparate interface standards within electronic systems. Interface bridge ICs are widely deployed across industrial automation, consumer electronics, PC peripherals, medical devices, telecommunications equipment, energy infrastructure, and automotive electronics, where modular design and multi-interface compatibility are essential.
Market Drivers and Demand Fundamentals –
The Interface Bridge ICs market is primarily driven by the rising demand for high-speed connectivity, system interoperability, and modular electronic design. As consumer electronics, automotive platforms, industrial IoT systems, and data centers increasingly adopt diverse interface standards, the need for reliable interface conversion solutions has become more pronounced.
The rapid adoption of next-generation standards such as USB4, Thunderbolt, PCIe Gen 5/6, and SATA 4.0 has further elevated the importance of interface bridging solutions. At the same time, the explosion of IoT devices, higher system integration levels, and rapid platform diversification are making interoperability a key design requirement. Additionally, pressure to shorten design cycles, reduce BOM costs, and improve power efficiency is accelerating the adoption of highly integrated, low-power bridge IC solutions.
Market Structure and Key Insights –
► Global market size reached US$ 493 million in 2024
► Market projected to reach US$ 899 million by 2031
► CAGR of 8.6% (2025-2031)
► Top three manufacturers account for approximately 29% of global revenue
► Production concentrated in the United States, Taiwan (China), and Europe, together accounting for over 70% of output
► Asia-Pacific is the largest consumption market, holding around 61% share, followed by North America (24%) and Europe (13%)
The market benefits from strong demand across both high-volume consumer applications and high-reliability industrial and automotive systems.
Technology Trends and Industry Development –
From a technology perspective, interface bridge IC development is focused on higher bandwidth, lower latency, reduced power consumption, and smaller footprints. Vendors are increasingly integrating multiple protocol conversion capabilities into single-chip solutions, enabling compact system design and improved signal integrity.
Advanced packaging technologies, improved power management, and enhanced compliance with evolving interface standards are supporting the deployment of bridge ICs in next-generation platforms, including edge computing, smart factories, and connected vehicles. These innovations are expected to drive replacement demand and sustain market growth through 2031.
Regional Market Outlook –
► Asia Pacific – dominant demand driven by consumer electronics manufacturing, industrial automation, and IoT deployment
► North America – strong adoption in data centers, automotive electronics, and high-end industrial systems
► Europe – stable growth supported by automotive, industrial, and healthcare electronics
► South America and Middle East & Africa – emerging opportunities linked to infrastructure and digital transformation initiatives
Competitive Landscape –
The global Interface Bridge ICs market is moderately fragmented, with competition centered on interface support breadth, performance reliability, power efficiency, and long-term product availability. Leading players benefit from strong design expertise and established customer relationships across multiple end markets.
Key companies profiled in the report include:
► FTDI
► Silicon Labs
► JMicron Technology
► Fujitsu
► Microchip
► Toshiba
► NXP
► Silicon Motion
► Texas Instruments
► ASMedia Technology
► Infineon
► MaxLinear
► Broadcom
► Initio Corporation
► ASIX, Holtek
Market Segmentation Highlights –
By Type
► USB Interface IC
► PCI / PCIe Interface IC
► SATA Interface IC
► Others
By Application
► Communication
► Industrial
► Healthcare
► Consumer Electronics
► Automobile
► Others
Each segment is analyzed in terms of sales volume, revenue contribution, growth dynamics, and future potential.
Reasons to Procure This Report –
► Access accurate global and regional market forecasts (2020-2031)
► Understand company market share, ranking, and competitive positioning
► Evaluate trade policy impacts and semiconductor supply chain risks
► Identify high-growth interface standards and application segments
► Support product planning, investment strategy, and technology roadmaps
Request for Pre-Order / Enquiry:
https://www.qyresearch.in/pre-order-inquiry/electronics-semiconductor-interface-bridge-ics-market-share-and-ranking-overall-sales-and-demand-forecast-2025-2031
Table of Content:
1 Market Overview
1.1 Interface Bridge ICs Product Introduction
1.2 Global Interface Bridge ICs Market Size Forecast
1.2.1 Global Interface Bridge ICs Sales Value (2020-2031)
1.2.2 Global Interface Bridge ICs Sales Volume (2020-2031)
1.2.3 Global Interface Bridge ICs Sales Price (2020-2031)
1.3 Interface Bridge ICs Market Trends & Drivers
1.3.1 Interface Bridge ICs Industry Trends
1.3.2 Interface Bridge ICs Market Drivers & Opportunity
1.3.3 Interface Bridge ICs Market Challenges
1.3.4 Interface Bridge ICs Market Restraints
1.4 Assumptions and Limitations
1.5 Study Objectives
1.6 Years Considered
2 Competitive Analysis by Company
2.1 Global Interface Bridge ICs Players Revenue Ranking (2024)
2.2 Global Interface Bridge ICs Revenue by Company (2020-2025)
2.3 Global Interface Bridge ICs Players Sales Volume Ranking (2024)
2.4 Global Interface Bridge ICs Sales Volume by Company Players (2020-2025)
2.5 Global Interface Bridge ICs Average Price by Company (2020-2025)
2.6 Key Manufacturers Interface Bridge ICs Manufacturing Base and Headquarters
2.7 Key Manufacturers Interface Bridge ICs Product Offered
2.8 Key Manufacturers Time to Begin Mass Production of Interface Bridge ICs
2.9 Interface Bridge ICs Market Competitive Analysis
2.9.1 Interface Bridge ICs Market Concentration Rate (2020-2025)
2.9.2 Global 5 and 10 Largest Manufacturers by Interface Bridge ICs Revenue in 2024
2.9.3 Global Top Manufacturers by Company Type (Tier 1, Tier 2, and Tier 3) & (based on the Revenue in Interface Bridge ICs as of 2024)
2.10 Mergers & Acquisitions, Expansion
3 Segmentation by Type
3.1 Introduction by Type
3.1.1 USB Interface IC
3.1.2 PCI(PCIe) Interface IC
3.1.3 SATA Interface IC
3.1.4 Others
3.2 Global Interface Bridge ICs Sales Value by Type
3.2.1 Global Interface Bridge ICs Sales Value by Type (2020 VS 2024 VS 2031)
3.2.2 Global Interface Bridge ICs Sales Value, by Type (2020-2031)
3.2.3 Global Interface Bridge ICs Sales Value, by Type (%) (2020-2031)
3.3 Global Interface Bridge ICs Sales Volume by Type
3.3.1 Global Interface Bridge ICs Sales Volume by Type (2020 VS 2024 VS 2031)
3.3.2 Global Interface Bridge ICs Sales Volume, by Type (2020-2031)
3.3.3 Global Interface Bridge ICs Sales Volume, by Type (%) (2020-2031)
3.4 Global Interface Bridge ICs Average Price by Type (2020-2031)
4 Segmentation by Data Rate
4.1 Introduction by Data Rate
4.1.1 Low-Speed (5 Gbps)
4.2 Global Interface Bridge ICs Sales Value by Data Rate
4.2.1 Global Interface Bridge ICs Sales Value by Data Rate (2020 VS 2024 VS 2031)
4.2.2 Global Interface Bridge ICs Sales Value, by Data Rate (2020-2031)
4.2.3 Global Interface Bridge ICs Sales Value, by Data Rate (%) (2020-2031)
4.3 Global Interface Bridge ICs Sales Volume by Data Rate
4.3.1 Global Interface Bridge ICs Sales Volume by Data Rate (2020 VS 2024 VS 2031)
4.3.2 Global Interface Bridge ICs Sales Volume, by Data Rate (2020-2031)
4.3.3 Global Interface Bridge ICs Sales Volume, by Data Rate (%) (2020-2031)
4.4 Global Interface Bridge ICs Average Price by Data Rate (2020-2031)
5 Segmentation by Mounting Type
5.1 Introduction by Mounting Type
5.1.1 On-Board
5.1.2 External
5.2 Global Interface Bridge ICs Sales Value by Mounting Type
5.2.1 Global Interface Bridge ICs Sales Value by Mounting Type (2020 VS 2024 VS 2031)
5.2.2 Global Interface Bridge ICs Sales Value, by Mounting Type (2020-2031)
5.2.3 Global Interface Bridge ICs Sales Value, by Mounting Type (%) (2020-2031)
5.3 Global Interface Bridge ICs Sales Volume by Mounting Type
5.3.1 Global Interface Bridge ICs Sales Volume by Mounting Type (2020 VS 2024 VS 2031) 5.3.2 Global Interface Bridge ICs Sales Volume, by Mounting Type (2020-2031)
5.3.3 Global Interface Bridge ICs Sales Volume, by Mounting Type (%) (2020-2031)
5.4 Global Interface Bridge ICs Average Price by Mounting Type (2020-2031)
6 Segmentation by Application
6.1 Introduction by Application
6.1.1 Communication
6.1.2 Industrial
6.1.3 Healthcare
6.1.4 Consumer Electronic
6.1.5 Automobile
6.1.6 Others
6.2 Global Interface Bridge ICs Sales Value by Application
6.2.1 Global Interface Bridge ICs Sales Value by Application (2020 VS 2024 VS 2031)
6.2.2 Global Interface Bridge ICs Sales Value, by Application (2020-2031)
6.2.3 Global Interface Bridge ICs Sales Value, by Application (%) (2020-2031)
6.3 Global Interface Bridge ICs Sales Volume by Application
6.3.1 Global Interface Bridge ICs Sales Volume by Application (2020 VS 2024 VS 2031)
6.3.2 Global Interface Bridge ICs Sales Volume, by Application (2020-2031)
6.3.3 Global Interface Bridge ICs Sales Volume, by Application (%) (2020-2031)
6.4 Global Interface Bridge ICs Average Price by Application (2020-2031)
7 Segmentation by Region
7.1 Global Interface Bridge ICs Sales Value by Region
7.1.1 Global Interface Bridge ICs Sales Value by Region: 2020 VS 2024 VS 2031
7.1.2 Global Interface Bridge ICs Sales Value by Region (2020-2025)
7.1.3 Global Interface Bridge ICs Sales Value by Region (2026-2031)
7.1.4 Global Interface Bridge ICs Sales Value by Region (%), (2020-2031)
7.2 Global Interface Bridge ICs Sales Volume by Region
7.2.1 Global Interface Bridge ICs Sales Volume by Region: 2020 VS 2024 VS 2031
7.2.2 Global Interface Bridge ICs Sales Volume by Region (2020-2025)
7.2.3 Global Interface Bridge ICs Sales Volume by Region (2026-2031)
7.2.4 Global Interface Bridge ICs Sales Volume by Region (%), (2020-2031)
7.3 Global Interface Bridge ICs Average Price by Region (2020-2031)
7.4 North America
7.4.1 North America Interface Bridge ICs Sales Value, 2020-2031
7.4.2 North America Interface Bridge ICs Sales Value by Country (%), 2024 VS 2031
7.5 Europe
7.5.1 Europe Interface Bridge ICs Sales Value, 2020-2031
7.5.2 Europe Interface Bridge ICs Sales Value by Country (%), 2024 VS 2031
7.6 Asia Pacific
7.6.1 Asia Pacific Interface Bridge ICs Sales Value, 2020-2031
7.6.2 Asia Pacific Interface Bridge ICs Sales Value by Region (%), 2024 VS 2031
7.7 South America
7.7.1 South America Interface Bridge ICs Sales Value, 2020-2031
7.7.2 South America Interface Bridge ICs Sales Value by Country (%), 2024 VS 2031
7.8 Middle East & Africa
7.8.1 Middle East & Africa Interface Bridge ICs Sales Value, 2020-2031
7.8.2 Middle East & Africa Interface Bridge ICs Sales Value by Country (%), 2024 VS 2031
8 Segmentation by Key Countries/Regions
8.1 Key Countries/Regions Interface Bridge ICs Sales Value Growth Trends, 2020 VS 2024 VS 2031
8.2 Key Countries/Regions Interface Bridge ICs Sales Value and Sales Volume
8.2.1 Key Countries/Regions Interface Bridge ICs Sales Value, 2020-2031
8.2.2 Key Countries/Regions Interface Bridge ICs Sales Volume, 2020-2031
8.3 United States
8.3.1 United States Interface Bridge ICs Sales Value, 2020-2031
8.3.2 United States Interface Bridge ICs Sales Value by Type (%), 2024 VS 2031
8.3.3 United States Interface Bridge ICs Sales Value by Application, 2024 VS 2031
8.4 Europe
8.4.1 Europe Interface Bridge ICs Sales Value, 2020-2031
8.4.2 Europe Interface Bridge ICs Sales Value by Type (%), 2024 VS 2031
8.4.3 Europe Interface Bridge ICs Sales Value by Application, 2024 VS 2031
8.5 China
8.5.1 China Interface Bridge ICs Sales Value, 2020-2031
8.5.2 China Interface Bridge ICs Sales Value by Type (%), 2024 VS 2031
8.5.3 China Interface Bridge ICs Sales Value by Application, 2024 VS 2031
8.6 Japan
8.6.1 Japan Interface Bridge ICs Sales Value, 2020-2031
8.6.2 Japan Interface Bridge ICs Sales Value by Type (%), 2024 VS 2031
8.6.3 Japan Interface Bridge ICs Sales Value by Application, 2024 VS 2031
8.7 South Korea
8.7.1 South Korea Interface Bridge ICs Sales Value, 2020-2031
8.7.2 South Korea Interface Bridge ICs Sales Value by Type (%), 2024 VS 2031
8.7.3 South Korea Interface Bridge ICs Sales Value by Application, 2024 VS 2031
8.8 Southeast Asia
8.8.1 Southeast Asia Interface Bridge ICs Sales Value, 2020-2031
8.8.2 Southeast Asia Interface Bridge ICs Sales Value by Type (%), 2024 VS 2031
8.8.3 Southeast Asia Interface Bridge ICs Sales Value by Application, 2024 VS 2031
8.9 India
8.9.1 India Interface Bridge ICs Sales Value, 2020-2031
8.9.2 India Interface Bridge ICs Sales Value by Type (%), 2024 VS 2031
8.9.3 India Interface Bridge ICs Sales Value by Application, 2024 VS 2031
9 Company Profiles
9.1 FTDI
9.1.1 FTDI Company Information
9.1.2 FTDI Introduction and Business Overview
9.1.3 FTDI Interface Bridge ICs Sales, Revenue, Price and Gross Margin (2020-2025)
9.1.4 FTDI Interface Bridge ICs Product Offerings
9.1.5 FTDI Recent Development
9.2 Silicon Labs
9.2.1 Silicon Labs Company Information
9.2.2 Silicon Labs Introduction and Business Overview
9.2.3 Silicon Labs Interface Bridge ICs Sales, Revenue, Price and Gross Margin (2020-2025)
9.2.4 Silicon Labs Interface Bridge ICs Product Offerings
9.2.5 Silicon Labs Recent Development
9.3 JMicron Technology
9.3.1 JMicron Technology Company Information
9.3.2 JMicron Technology Introduction and Business Overview
9.3.3 JMicron Technology Interface Bridge ICs Sales, Revenue, Price and Gross Margin (2020-2025)
9.3.4 JMicron Technology Interface Bridge ICs Product Offerings
9.3.5 JMicron Technology Recent Development
9.4 Fujitsu
9.4.1 Fujitsu Company Information
9.4.2 Fujitsu Introduction and Business Overview
9.4.3 Fujitsu Interface Bridge ICs Sales, Revenue, Price and Gross Margin (2020-2025)
9.4.4 Fujitsu Interface Bridge ICs Product Offerings
9.4.5 Fujitsu Recent Development
9.5 Microchip
9.5.1 Microchip Company Information
9.5.2 Microchip Introduction and Business Overview
9.5.3 Microchip Interface Bridge ICs Sales, Revenue, Price and Gross Margin (2020-2025)
9.5.4 Microchip Interface Bridge ICs Product Offerings
9.5.5 Microchip Recent Development
9.6 Toshiba
9.6.1 Toshiba Company Information
9.6.2 Toshiba Introduction and Business Overview
9.6.3 Toshiba Interface Bridge ICs Sales, Revenue, Price and Gross Margin (2020-2025)
9.6.4 Toshiba Interface Bridge ICs Product Offerings
9.6.5 Toshiba Recent Development
9.7 NXP
9.7.1 NXP Company Information
9.7.2 NXP Introduction and Business Overview
9.7.3 NXP Interface Bridge ICs Sales, Revenue, Price and Gross Margin (2020-2025)
9.7.4 NXP Interface Bridge ICs Product Offerings
9.7.5 NXP Recent Development
9.8 Silicon Motion
9.8.1 Silicon Motion Company Information
9.8.2 Silicon Motion Introduction and Business Overview
9.8.3 Silicon Motion Interface Bridge ICs Sales, Revenue, Price and Gross Margin (2020-2025)
9.8.4 Silicon Motion Interface Bridge ICs Product Offerings
9.8.5 Silicon Motion Recent Development
9.9 TI
9.9.1 TI Company Information
9.9.2 TI Introduction and Business Overview
9.9.3 TI Interface Bridge ICs Sales, Revenue, Price and Gross Margin (2020-2025)
9.9.4 TI Interface Bridge ICs Product Offerings
9.9.5 TI Recent Development
9.10 ASMedia Technology
9.10.1 ASMedia Technology Company Information
9.10.2 ASMedia Technology Introduction and Business Overview
9.10.3 ASMedia Technology Interface Bridge ICs Sales, Revenue, Price and Gross Margin (2020-2025)
9.10.4 ASMedia Technology Interface Bridge ICs Product Offerings
9.10.5 ASMedia Technology Recent Development
9.11 Infineon
9.11.1 Infineon Company Information
9.11.2 Infineon Introduction and Business Overview
9.11.3 Infineon Interface Bridge ICs Sales, Revenue, Price and Gross Margin (2020-2025)
9.11.4 Infineon Interface Bridge ICs Product Offerings
9.11.5 Infineon Recent Development
9.12 MaxLinear
9.12.1 MaxLinear Company Information
9.12.2 MaxLinear Introduction and Business Overview
9.12.3 MaxLinear Interface Bridge ICs Sales, Revenue, Price and Gross Margin (2020-2025)
9.12.4 MaxLinear Interface Bridge ICs Product Offerings
9.12.5 MaxLinear Recent Development
9.13 Broadcom
9.13.1 Broadcom Company Information
9.13.2 Broadcom Introduction and Business Overview
9.13.3 Broadcom Interface Bridge ICs Sales, Revenue, Price and Gross Margin (2020-2025)
9.13.4 Broadcom Interface Bridge ICs Product Offerings
9.13.5 Broadcom Recent Development
9.14 Initio Corporation
9.14.1 Initio Corporation Company Information
9.14.2 Initio Corporation Introduction and Business Overview
9.14.3 Initio Corporation Interface Bridge ICs Sales, Revenue, Price and Gross Margin (2020-2025)
9.14.4 Initio Corporation Interface Bridge ICs Product Offerings
9.14.5 Initio Corporation Recent Development
9.15 ASIX
9.15.1 ASIX Company Information
9.15.2 ASIX Introduction and Business Overview
9.15.3 ASIX Interface Bridge ICs Sales, Revenue, Price and Gross Margin (2020-2025)
9.15.4 ASIX Interface Bridge ICs Product Offerings
9.15.5 ASIX Recent Development
9.16 Holtek
9.16.1 Holtek Company Information
9.16.2 Holtek Introduction and Business Overview
9.16.3 Holtek Interface Bridge ICs Sales, Revenue, Price and Gross Margin (2020-2025)
9.16.4 Holtek Interface Bridge ICs Product Offerings
9.16.5 Holtek Recent Development
10 Industry Chain Analysis
10.1 Interface Bridge ICs Industrial Chain
10.2 Interface Bridge ICs Upstream Analysis
10.2.1 Key Raw Materials
10.2.2 Raw Materials Key Suppliers
10.2.3 Manufacturing Cost Structure
10.3 Midstream Analysis
10.4 Downstream Analysis (Customers Analysis)
10.5 Sales Model and Sales Channels
10.5.1 Interface Bridge ICs Sales Model
10.5.2 Sales Channel
10.5.3 Interface Bridge ICs Distributors
11 Research Findings and Conclusion
12 Appendix
12.1 Research Methodology
12.1.1 Methodology/Research Approach
12.1.1.1 Research Programs/Design
12.1.1.2 Market Size Estimation
12.1.1.3 Market Breakdown and Data Triangulation
12.1.2 Data Source
12.1.2.1 Secondary Sources
12.1.2.2 Primary Sources
12.2 Author Details
12.3 Disclaimer
QY Research PVT. LTD.
315 Work Avenue,
Raheja Woods,
6th Floor, Kalyani Nagar,
Yervada, Pune – 411060,
Maharashtra, India
India: (O) +91 866 998 6909
USA: (O) +1 626 295 2442
Email: hitesh@qyresearch.com
Web: http://www.qyresearch.in
About Us –
QY Research, established in 2007, is a globally recognized market research and consulting firm delivering syndicated and customized research solutions across semiconductors, electronics, communication technologies, automotive systems, industrial automation, and advanced materials. With more than 50,000 clients across over 80 countries, QY Research combines rigorous research methodologies, deep domain expertise, and actionable insights to support data-driven decision-making and long-term business growth.
This release was published on openPR.