/ Q1 2025 Results
- Revenue of $504.9 million
- GAAP diluted earnings per share of $0.59 and non-GAAP diluted earnings per share of $1.64
- GAAP operating profit margin of 11.7% and non-GAAP operating profit margin of 33.5%
- Operating cash flows of $398.9 million and unlevered operating cash flows of $407.1 million
- Annual contract value (ACV) of $410.1 million
- Deferred revenue and backlog of $1,627.7 million on March 31, 2025
PITTSBURGH, April 30, 2025 (GLOBE NEWSWIRE) — ANSYS, Inc. (NASDAQ: ANSS) today reported first quarter 2025 revenue of $504.9 million, an increase of 8% in reported currency, or 10% in constant currency, when compared to the first quarter of 2024. For the first quarter of 2025, the Company reported diluted earnings per share of $0.59 and $1.64 on a GAAP and non-GAAP basis, respectively, compared to $0.40 and $1.39 on a GAAP and non-GAAP basis, respectively, for the first quarter of 2024. Additionally, the Company reported first quarter ACV growth of 1% in reported currency, or 2% in constant currency, when compared to the first quarter of 2024. The results for the first quarter met the Company’s expectations and it continues to expect double-digit FY 2025 ACV growth.
As previously announced, on January 15, 2024, Ansys entered into a definitive agreement with Synopsys, Inc. (“Synopsys”) under which Synopsys will acquire Ansys. Since the Company’s last earnings release, the U.K. Competition and Markets Authority has formally cleared the transaction in Phase 1 subject to previously announced divestitures. Additionally, Ansys and Synopsys have received clearances from the Turkey Competition Authority, Japan Fair Trade Commission, Korea Fair Trade Commission and Taiwan Fair Trade Commission. We continue to work with the regulators in other relevant jurisdictions to conclude their reviews. The transaction is anticipated to close in the first half of 2025, subject to the receipt of required regulatory approvals and other customary closing conditions. As previously announced, in light of the pending transaction with Synopsys, Ansys has suspended quarterly earnings conference calls and no longer provides quarterly or annual guidance.
The non-GAAP financial results highlighted represent non-GAAP financial measures. Reconciliations of these measures to the comparable GAAP measures can be found later in this release.
/ Summary of Financial Results
Ansys’ first quarter 2025 and 2024 financial results are presented below. The 2025 and 2024 non-GAAP results exclude the income statement effects of stock-based compensation, excess payroll taxes related to stock-based compensation, amortization of acquired intangible assets, expenses related to business combinations and adjustments for the income tax effect of the excluded items.
Our results are as follows:
| GAAP | ||||||||||
| (in thousands, except per share data and percentages) | Q1 2025 | Q1 2024 | % Change | |||||||
| Revenue | $ | 504,891 | $ | 466,605 | 8.2 | % | ||||
| Net income | $ | 51,865 | $ | 34,778 | 49.1 | % | ||||
| Diluted earnings per share | $ | 0.59 | $ | 0.40 | 47.5 | % | ||||
| Gross margin | 85.6 | % | 85.3 | % | ||||||
| Operating profit margin | 11.7 | % | 9.3 | % | ||||||
| Effective tax rate | 19.6 | % | 15.1 | % | ||||||
| Non-GAAP | ||||||||||
| (in thousands, except per share data and percentages) | Q1 2025 | Q1 2024 | % Change | |||||||
| Net income | $ | 144,149 | $ | 121,996 | 18.2 | % | ||||
| Diluted earnings per share | $ | 1.64 | $ | 1.39 | 18.0 | % | ||||
| Gross margin | 91.2 | % | 90.9 | % | ||||||
| Operating profit margin | 33.5 | % | 32.2 | % | ||||||
| Effective tax rate | 17.5 | % | 17.5 | % | ||||||
| Other Metrics | ||||||||
| (in thousands, except percentages) | Q1 2025 | Q1 2024 | % Change | |||||
| ACV | $ | 410,068 | $ | 407,405 | 0.7 | % | ||
| Operating cash flows | $ | 398,935 | $ | 282,817 | 41.1 | % | ||
| Unlevered operating cash flows | $ | 407,128 | $ | 292,667 | 39.1 | % | ||
| Supplemental Financial Information |
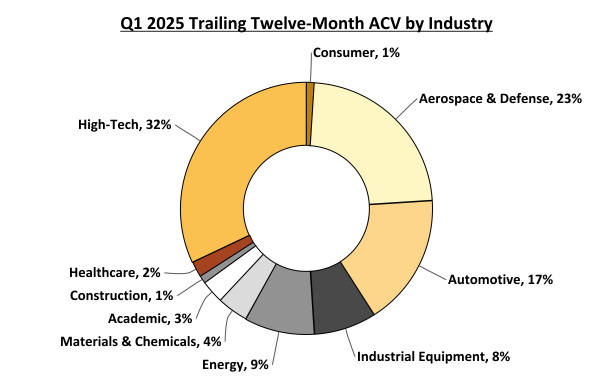
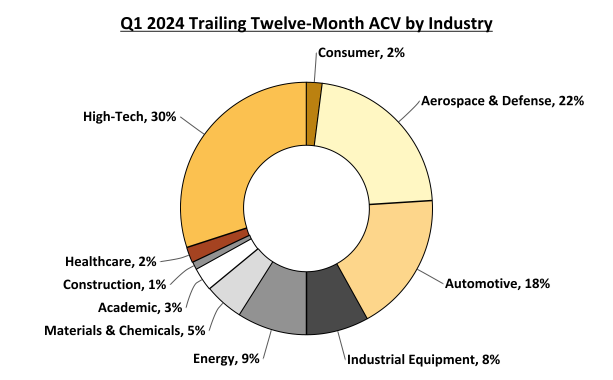
/ Annual Contract Value
| (in thousands, except percentages) | Q1 2025 | Q1 2025 in Constant Currency | Q1 2024 | % Change | % Change in Constant Currency | |||||||||
| ACV | $ | 410,068 | $ | 416,640 | $ | 407,405 | 0.7 | % | 2.3 | % | ||||

Recurring ACV includes both subscription lease ACV and all maintenance ACV (including maintenance from perpetual licenses). It excludes perpetual license ACV and service ACV.
/ Revenue
| (in thousands, except percentages) | Q1 2025 | Q1 2025 in Constant Currency | Q1 2024 | % Change | % Change in Constant Currency | |||||||||
| Revenue | $ | 504,891 | $ | 512,570 | $ | 466,605 | 8.2 | % | 9.9 | % | ||||
| REVENUE BY LICENSE TYPE | |||||||||||||||||
| (in thousands, except percentages) | Q1 2025 | % of Total | Q1 2024 | % of Total | % Change | % Change in Constant Currency | |||||||||||
| Subscription Lease | $ | 96,919 | 19.2 | % | $ | 94,800 | 20.3 | % | 2.2 | % | 4.0 | % | |||||
| Perpetual | 63,036 | 12.5 | % | 65,521 | 14.0 | % | (3.8)% | (2.9)% | |||||||||
| Maintenance1 | 324,392 | 64.2 | % | 289,340 | 62.0 | % | 12.1 | % | 13.9 | % | |||||||
| Service | 20,544 | 4.1 | % | 16,944 | 3.6 | % | 21.2 | % | 22.5 | % | |||||||
| Total | $ | 504,891 | $ | 466,605 | 8.2 | % | 9.9 | % | |||||||||
1Maintenance revenue is inclusive of both maintenance associated with perpetual licenses and the maintenance component of subscription leases.
| REVENUE BY GEOGRAPHY | |||||||||||||||||
| (in thousands, except percentages) | Q1 2025 | % of Total | Q1 2024 | % of Total | % Change | % Change in Constant Currency | |||||||||||
| Americas | $ | 230,377 | 45.6 | % | $ | 208,697 | 44.7 | % | 10.4 | % | 10.5 | % | |||||
| Germany | 35,021 | 6.9 | % | 36,198 | 7.8 | % | (3.3)% | (0.4)% | |||||||||
| Other EMEA | 83,839 | 16.6 | % | 82,417 | 17.7 | % | 1.7 | % | 3.9 | % | |||||||
| EMEA | 118,860 | 23.5 | % | 118,615 | 25.4 | % | 0.2 | % | 2.6 | % | |||||||
| Japan | 43,297 | 8.6 | % | 36,532 | 7.8 | % | 18.5 | % | 20.9 | % | |||||||
| Other Asia-Pacific | 112,357 | 22.3 | % | 102,761 | 22.0 | % | 9.3 | % | 12.9 | % | |||||||
| Asia-Pacific | 155,654 | 30.8 | % | 139,293 | 29.9 | % | 11.7 | % | 15.0 | % | |||||||
| Total | $ | 504,891 | $ | 466,605 | 8.2 | % | 9.9 | % | |||||||||
| REVENUE BY CHANNEL | |||||
| Q1 2025 | Q1 2024 | ||||
| Direct revenue, as a percentage of total revenue | 69.1 | % | 66.5 | % | |
| Indirect revenue, as a percentage of total revenue | 30.9 | % | 33.5 | % | |
/ Deferred Revenue and Backlog
| (in thousands) | March 31, 2025 | December 31, 2024 | March 31, 2024 | |||||
| Current Deferred Revenue | $ | 490,318 | $ | 504,527 | $ | 433,167 | ||
| Current Backlog | 511,197 | 524,617 | 433,106 | |||||
| Total Current Deferred Revenue and Backlog | 1,001,515 | 1,029,144 | 866,273 | |||||
| Long-Term Deferred Revenue | 30,840 | 31,778 | 21,434 | |||||
| Long-Term Backlog | 595,388 | 657,345 | 481,746 | |||||
| Total Long-Term Deferred Revenue and Backlog | 626,228 | 689,123 | 503,180 | |||||
| Total Deferred Revenue and Backlog | $ | 1,627,743 | $ | 1,718,267 | $ | 1,369,453 | ||
/ Currency
The first quarter of 2025 revenue, operating income and ACV, as compared to the first quarter of 2024, were impacted by fluctuations in the exchange rates of foreign currencies against the U.S. Dollar. The currency fluctuation impacts on revenue, GAAP and non-GAAP operating income and ACV based on 2024 exchange rates are reflected in the tables below. Deferred revenue and backlog as of March 31, 2025, as compared to the balances at December 31, 2024, were also impacted by fluctuations in the exchange rates of foreign currencies against the U.S. Dollar. Amounts in brackets indicate an adverse impact from currency fluctuations.
| (in thousands) | Q1 2025 | ||
| Revenue | $ | (7,679 | ) |
| GAAP operating income | $ | (2,848 | ) |
| Non-GAAP operating income | $ | (3,044 | ) |
| ACV | $ | (6,572 | ) |
| Deferred revenue and backlog | $ | 19,166 | |
The most meaningful currency impacts are typically attributable to U.S. Dollar exchange rate changes against the Euro and Japanese Yen. Historical exchange rates are reflected in the charts below.
| Period-End Exchange Rates | |||
| As of | EUR/USD | USD/JPY | |
| March 31, 2025 | 1.08 | 150 | |
| December 31, 2024 | 1.04 | 157 | |
| March 31, 2024 | 1.08 | 151 | |
| Average Exchange Rates | |||
| Three Months Ended | EUR/USD | USD/JPY | |
| March 31, 2025 | 1.05 | 152 | |
| March 31, 2024 | 1.09 | 148 | |
/ GAAP Financial Statements
| ANSYS, INC. AND SUBSIDIARIES | |||||
| Condensed Consolidated Balance Sheets | |||||
| (Unaudited) | |||||
| (in thousands) | March 31, 2025 | December 31, 2024 | |||
| ASSETS: | |||||
| Cash & short-term investments | $ | 1,828,559 | $ | 1,497,517 | |
| Accounts receivable, net | 754,655 | 1,022,850 | |||
| Goodwill | 3,799,809 | 3,778,128 | |||
| Other intangibles, net | 694,235 | 716,244 | |||
| Other assets | 903,755 | 1,036,692 | |||
| Total assets | $ | 7,981,013 | $ | 8,051,431 | |
| LIABILITIES & STOCKHOLDERS’ EQUITY: | |||||
| Current deferred revenue | $ | 490,318 | $ | 504,527 | |
| Long-term debt | 754,287 | 754,208 | |||
| Other liabilities | 556,933 | 706,256 | |||
| Stockholders’ equity | 6,179,475 | 6,086,440 | |||
| Total liabilities & stockholders’ equity | $ | 7,981,013 | $ | 8,051,431 | |
| ANSYS, INC. AND SUBSIDIARIES | ||||||||
| Condensed Consolidated Statements of Income | ||||||||
| (Unaudited) | ||||||||
| Three Months Ended | ||||||||
| (in thousands, except per share data) | March 31, 2025 | March 31, 2024 | ||||||
| Revenue: | ||||||||
| Software licenses | $ | 159,955 | $ | 160,321 | ||||
| Maintenance and service | 344,936 | 306,284 | ||||||
| Total revenue | 504,891 | 466,605 | ||||||
| Cost of sales: | ||||||||
| Software licenses | 9,370 | 10,044 | ||||||
| Amortization | 23,429 | 22,484 | ||||||
| Maintenance and service | 39,770 | 36,139 | ||||||
| Total cost of sales | 72,569 | 68,667 | ||||||
| Gross profit | 432,322 | 397,938 | ||||||
| Operating expenses: | ||||||||
| Selling, general and administrative | 230,415 | 219,643 | ||||||
| Research and development | 137,292 | 128,811 | ||||||
| Amortization | 5,722 | 6,145 | ||||||
| Total operating expenses | 373,429 | 354,599 | ||||||
| Operating income | 58,893 | 43,339 | ||||||
| Interest income | 16,743 | 10,995 | ||||||
| Interest expense | (10,177 | ) | (12,369 | ) | ||||
| Other expense, net | (930 | ) | (1,007 | ) | ||||
| Income before income tax provision | 64,529 | 40,958 | ||||||
| Income tax provision | 12,664 | 6,180 | ||||||
| Net income | $ | 51,865 | $ | 34,778 | ||||
| Earnings per share – basic: | ||||||||
| Earnings per share | $ | 0.59 | $ | 0.40 | ||||
| Weighted average shares | 87,653 | 87,067 | ||||||
| Earnings per share – diluted: | ||||||||
| Earnings per share | $ | 0.59 | $ | 0.40 | ||||
| Weighted average shares | 88,127 | 87,780 | ||||||
/ Glossary of Terms
Annual Contract Value (ACV): ACV is a key performance metric and is useful to investors in assessing the strength and trajectory of our business. ACV is a supplemental metric to help evaluate the annual performance of the business. Over the life of the contract, ACV equals the total value realized from a customer. ACV is not impacted by the timing of license revenue recognition. ACV is used by management in financial and operational decision-making and in setting sales targets used for compensation. ACV is not a replacement for, and should be viewed independently of, GAAP revenue and deferred revenue as ACV is a performance metric and is not intended to be combined with any of these items. There is no GAAP measure comparable to ACV. ACV is composed of the following:
- the annualized value of maintenance and subscription lease contracts with start dates or anniversary dates during the period, plus
- the value of perpetual license contracts with start dates during the period, plus
- the annualized value of fixed-term services contracts with start dates or anniversary dates during the period, plus
- the value of work performed during the period on fixed-deliverable services contracts.
When we refer to the anniversary dates in the definition of ACV above, we are referencing the date of the beginning of the next twelve-month period in a contractually committed multi-year contract. If a contract is three years in duration, with a start date of July 1, 2025, the anniversary dates would be July 1, 2026 and July 1, 2027. We label these anniversary dates as they are contractually committed. While this contract would be up for renewal on July 1, 2028, our ACV performance metric does not assume any contract renewals.
Example 1: For purposes of calculating ACV, a $100,000 subscription lease contract or a $100,000 maintenance contract with a term of July 1, 2025 – June 30, 2026 would each contribute $100,000 to ACV for fiscal year 2025 with no contribution to ACV for fiscal year 2026.
Example 2: For purposes of calculating ACV, a $300,000 subscription lease contract or a $300,000 maintenance contract with a term of July 1, 2025 – June 30, 2028 would each contribute $100,000 to ACV in each of fiscal years 2025, 2026 and 2027. There would be no contribution to ACV for fiscal year 2028 as each period captures the full annual value upon the anniversary date.
Example 3: A perpetual license valued at $200,000 with a contract start date of March 1, 2025 would contribute $200,000 to ACV in fiscal year 2025.
Backlog: Deferred revenue associated with installment billings for periods beyond the current quarterly billing cycle and committed contracts with start dates beyond the end of the current period.
Deferred Revenue: Billings made or payments received in advance of revenue recognition.
Subscription Lease or Time-Based License: A license of a stated product of our software that is granted to a customer for use over a specified time period, which can be months or years in length. In addition to the use of the software, the customer is provided with access to maintenance (unspecified version upgrades and technical support) without additional charge. The revenue related to these contracts is recognized ratably over the contract period for the maintenance portion and up front for the license portion.
Perpetual / Paid-Up License: A license of a stated product and version of our software that is granted to a customer for use in perpetuity. The revenue related to this type of license is recognized up front.
Maintenance: A contract, typically one year in duration, that is purchased by the owner of a perpetual license and that provides access to unspecified version upgrades and technical support during the duration of the contract. The revenue from these contracts is recognized ratably over the contract period.
/ Reconciliations of GAAP to Non-GAAP Measures (Unaudited)
| Three Months Ended | |||||||||||||||||||
| March 31, 2025 | |||||||||||||||||||
| (in thousands, except percentages and per share data) | Gross Profit | % of Revenue | Operating Income | % of Revenue | Net Income | EPS – Diluted1 | |||||||||||||
| Total GAAP | $ | 432,322 | 85.6 | % | $ | 58,893 | 11.7 | % | $ | 51,865 | $ | 0.59 | |||||||
| Stock-based compensation expense | 3,977 | 0.8 | % | 70,243 | 14.0 | % | 70,243 | 0.80 | |||||||||||
| Excess payroll taxes related to stock-based awards | 354 | 0.1 | % | 6,016 | 1.2 | % | 6,016 | 0.07 | |||||||||||
| Amortization of intangible assets from acquisitions | 23,429 | 4.6 | % | 29,151 | 5.7 | % | 29,151 | 0.33 | |||||||||||
| Expenses related to business combinations | 405 | 0.1 | % | 4,787 | 0.9 | % | 4,787 | 0.05 | |||||||||||
| Adjustment for income tax effect | — | — | % | — | — | % | (17,913 | ) | (0.20 | ) | |||||||||
| Total non-GAAP | $ | 460,487 | 91.2 | % | $ | 169,090 | 33.5 | % | $ | 144,149 | $ | 1.64 | |||||||
1 Diluted weighted average shares were 88,127.
| Three Months Ended | |||||||||||||||||||
| March 31, 2024 | |||||||||||||||||||
| (in thousands, except percentages and per share data) | Gross Profit | % of Revenue | Operating Income | % of Revenue | Net Income | EPS – Diluted1 | |||||||||||||
| Total GAAP | $ | 397,938 | 85.3 | % | $ | 43,339 | 9.3 | % | $ | 34,778 | $ | 0.40 | |||||||
| Stock-based compensation expense | 3,343 | 0.7 | % | 58,664 | 12.7 | % | 58,664 | 0.66 | |||||||||||
| Excess payroll taxes related to stock-based awards | 378 | 0.1 | % | 5,362 | 1.1 | % | 5,362 | 0.06 | |||||||||||
| Amortization of intangible assets from acquisitions | 22,484 | 4.8 | % | 28,629 | 6.1 | % | 28,629 | 0.33 | |||||||||||
| Expenses related to business combinations | — | — | % | 14,261 | 3.0 | % | 14,261 | 0.16 | |||||||||||
| Adjustment for income tax effect | — | — | % | — | — | % | (19,698 | ) | (0.22 | ) | |||||||||
| Total non-GAAP | $ | 424,143 | 90.9 | % | $ | 150,255 | 32.2 | % | $ | 121,996 | $ | 1.39 | |||||||
1 Diluted weighted average shares were 87,780.
| Three Months Ended | |||||||
| (in thousands) | March 31, 2025 | March 31, 2024 | |||||
| Net cash provided by operating activities | $ | 398,935 | $ | 282,817 | |||
| Cash paid for interest | 9,931 | 11,939 | |||||
| Tax benefit | (1,738 | ) | (2,089 | ) | |||
| Unlevered operating cash flows | $ | 407,128 | $ | 292,667 | |||
/ Use of Non-GAAP Measures
We provide non-GAAP gross profit, non-GAAP gross profit margin, non-GAAP operating income, non-GAAP operating profit margin, non-GAAP net income, non-GAAP diluted earnings per share and unlevered operating cash flows as supplemental measures to GAAP regarding our operational performance. These financial measures exclude the impact of certain items and, therefore, have not been calculated in accordance with GAAP. A detailed explanation of each of the adjustments to these financial measures is described below. This press release also contains a reconciliation of each of these non-GAAP financial measures to its most comparable GAAP financial measure, as applicable.
We use non-GAAP financial measures (a) to evaluate our historical and prospective financial performance as well as our performance relative to our competitors, (b) to set internal sales targets and spending budgets, (c) to allocate resources, (d) to measure operational profitability and the accuracy of forecasting, (e) to assess financial discipline over operational expenditures and (f) as an important factor in determining variable compensation for management and employees. In addition, many financial analysts that follow us focus on and publish both historical results and future projections based on non-GAAP financial measures. We believe that it is in the best interest of our investors to provide this information to analysts so that they accurately report the non-GAAP financial information. Moreover, investors have historically requested, and we have historically reported, these non-GAAP financial measures as a means of providing consistent and comparable information with past reports of financial results.
While we believe that these non-GAAP financial measures provide useful supplemental information to investors, there are limitations associated with the use of these non-GAAP financial measures. These non-GAAP financial measures are not prepared in accordance with GAAP, are not reported by all our competitors and may not be directly comparable to similarly titled measures of our competitors due to potential differences in the exact method of calculation. We compensate for these limitations by using these non-GAAP financial measures as supplements to GAAP financial measures and by reviewing the reconciliations of the non-GAAP financial measures to their most comparable GAAP financial measures.
The adjustments to these non-GAAP financial measures, and the basis for such adjustments, are outlined below:
Amortization of intangible assets from acquisitions. We incur amortization of intangible assets, included in our GAAP presentation of amortization expense, related to various acquisitions we have made. We exclude these expenses for the purpose of calculating non-GAAP gross profit, non-GAAP gross profit margin, non-GAAP operating income, non-GAAP operating profit margin, non-GAAP net income and non-GAAP diluted earnings per share when we evaluate our continuing operational performance because these costs are fixed at the time of an acquisition, are then amortized over a period of several years after the acquisition and generally cannot be changed or influenced by us after the acquisition. Accordingly, we do not consider these expenses for purposes of evaluating our performance during the applicable time period after the acquisition, and we exclude such expenses when making decisions to allocate resources. We believe that these non-GAAP financial measures are useful to investors because they allow investors to (a) evaluate the effectiveness of the methodology and information used by us in our financial and operational decision-making, and (b) compare our past reports of financial results as we have historically reported these non-GAAP financial measures.
Stock-based compensation expense. We incur expense related to stock-based compensation included in our GAAP presentation of cost of maintenance and service; research and development expense; and selling, general and administrative expense. We also incur excess payroll tax expense related to stock-based compensation, which is an additional non-GAAP adjustment. Although stock-based compensation is an expense and viewed as a form of compensation, we exclude these expenses for the purpose of calculating non-GAAP gross profit, non-GAAP gross profit margin, non-GAAP operating income, non-GAAP operating profit margin, non-GAAP net income and non-GAAP diluted earnings per share when we evaluate our continuing operational performance. Specifically, we exclude stock-based compensation during our annual budgeting process and our quarterly and annual assessments of our performance. The annual budgeting process is the primary mechanism whereby we allocate resources to various initiatives and operational requirements. Additionally, the annual review by our Board of Directors during which it compares our historical business model and profitability to the planned business model and profitability for the forthcoming year excludes the impact of stock-based compensation. In evaluating the performance of our senior management and department managers, charges related to stock-based compensation are excluded from expenditure and profitability results. In fact, we record stock-based compensation expense into a stand-alone cost center for which no single operational manager is responsible or accountable. In this way, we can review, on a period-to-period basis, each manager’s performance and assess financial discipline over operational expenditures without the effect of stock-based compensation. We believe that these non-GAAP financial measures are useful to investors because they allow investors to (a) evaluate our operating results and the effectiveness of the methodology used by us to review our operating results, and (b) review historical comparability in our financial reporting as well as comparability with competitors’ operating results.
Expenses related to business combinations. We incur expenses for professional services rendered in connection with acquisitions and divestitures, which are included in our GAAP presentation of selling, general and administrative expense. We also incur other expenses directly related to business combinations, including compensation expenses and concurrent restructuring activities, such as employee severances and other exit costs. These costs are included in our GAAP presentation of cost of maintenance and service, selling, general and administrative and research and development expenses. We exclude these acquisition-related expenses for the purpose of calculating non-GAAP gross profit, non-GAAP gross profit margin, non-GAAP operating income, non-GAAP operating profit margin, non-GAAP net income and non-GAAP diluted earnings per share when we evaluate our continuing operational performance, as we generally would not have otherwise incurred these expenses in the periods presented as a part of our operations. We believe that these non-GAAP financial measures are useful to investors because they allow investors to (a) evaluate our operating results and the effectiveness of the methodology used by us to review our operating results, and (b) review historical comparability in our financial reporting as well as comparability with competitors’ operating results.
Non-GAAP tax provision. We utilize a normalized non-GAAP annual effective tax rate (AETR) to calculate non-GAAP measures. This methodology provides better consistency across interim reporting periods by eliminating the effects of non-recurring items and aligning the non-GAAP tax rate with our expected geographic earnings mix. To project this rate, we analyzed our historic and projected non-GAAP earnings mix by geography along with other factors such as our current tax structure, recurring tax credits and incentives, and expected tax positions. On an annual basis we re-evaluate and update this rate for significant items that may materially affect our projections.
Unlevered operating cash flows. We make cash payments for the interest incurred in connection with our debt financing which are included in our GAAP presentation of operating cash flows. We exclude this cash paid for interest, net of the associated tax benefit, for the purpose of calculating unlevered operating cash flows. Unlevered operating cash flow is a supplemental non-GAAP measure that we use to evaluate our core operating business. We believe this measure is useful to investors and management because it provides a measure of our cash generated through operating activities independent of the capital structure of the business.
Non-GAAP financial measures are not in accordance with, or an alternative for, GAAP. Our non-GAAP financial measures are not meant to be considered in isolation or as a substitute for comparable GAAP financial measures and should be read only in conjunction with our consolidated financial statements prepared in accordance with GAAP.
We have provided a reconciliation of the non-GAAP financial measures to the most directly comparable GAAP financial measures as listed below:
| GAAP Reporting Measure | Non-GAAP Reporting Measure |
| Gross Profit | Non-GAAP Gross Profit |
| Gross Profit Margin | Non-GAAP Gross Profit Margin |
| Operating Income | Non-GAAP Operating Income |
| Operating Profit Margin | Non-GAAP Operating Profit Margin |
| Net Income | Non-GAAP Net Income |
| Diluted Earnings Per Share | Non-GAAP Diluted Earnings Per Share |
| Operating Cash Flows | Unlevered Operating Cash Flows |
Constant currency. In addition to the non-GAAP financial measures detailed above, we use constant currency results for financial and operational decision-making and as a means to evaluate period-to-period comparisons by excluding the effects of foreign currency fluctuations on the reported results. To present this information, the 2025 period results for entities whose functional currency is a currency other than the U.S. Dollar were converted to U.S. Dollars at rates that were in effect for the 2024 comparable period, rather than the actual exchange rates in effect for 2025. Constant currency growth rates are calculated by adjusting the 2025 period reported amounts by the 2025 currency fluctuation impacts and comparing the adjusted amounts to the 2024 comparable period reported amounts. We believe that these non-GAAP financial measures are useful to investors because they allow investors to (a) evaluate the effectiveness of the methodology and information used by us in our financial and operational decision-making, and (b) compare our reported results to our past reports of financial results without the effects of foreign currency fluctuations.
/ About Ansys
Our Mission: Powering Innovation that Drives Human Advancement™
When visionary companies need to know how their world-changing ideas will perform, they close the gap between design and reality with Ansys simulation. For more than 50 years, Ansys software has enabled innovators across industries to push boundaries by using the predictive power of simulation. From sustainable transportation to advanced semiconductors, from satellite systems to life-saving medical devices, the next great leaps in human advancement will be powered by Ansys.
/ Forward-Looking Information
This document contains forward-looking statements within the meaning of Section 27A of the Securities Act of 1933, as amended (the Securities Act), and Section 21E of the Securities Exchange Act of 1934, as amended (the Exchange Act). Forward-looking statements are statements that provide current expectations or forecasts of future events based on certain assumptions. Forward-looking statements are subject to risks, uncertainties, and factors relating to our business which could cause our actual results to differ materially from the expectations expressed in or implied by such forward-looking statements.
Forward-looking statements use words such as “anticipate,” “believe,” “could,” “estimate,” “expect,” “forecast,” “intend,” “likely,” “may,” “outlook,” “plan,” “predict,” “project,” “should,” “target” or other words of similar meaning. Forward-looking statements include those about the proposed transaction with Synopsys, including the expected date of closing and the potential benefits thereof, and other aspects of future operations. We caution readers not to place undue reliance upon any such forward-looking statements, which speak only as of the date they are made. We undertake no obligation to update forward-looking statements, whether as a result of new information, future events or otherwise, except as may be required by law.
The risks associated with the following, among others, could cause actual results to differ materially from those described in any forward-looking statements:
- our ability to complete the proposed transaction with Synopsys on anticipated terms and timing, including completing the associated divestiture of our PowerArtist RTL business and obtaining regulatory approvals, and other conditions related to the completion of the transaction with Synopsys;
- the realization of the anticipated benefits of the proposed transaction with Synopsys, including potential disruptions to our and Synopsys’ businesses and commercial relationships with others resulting from the announcement, pendency or completion of the proposed transaction and uncertainty as to the long-term value of Synopsys’ common stock;
- restrictions on our operations during the pendency of the proposed transaction with Synopsys that could impact our ability to pursue certain business opportunities or strategic transactions, including tuck-in M&A;
- adverse conditions in the macroeconomic environment, including inflation, recessionary conditions and volatility in equity and foreign exchange markets;
- political, economic and regulatory uncertainties in the countries and regions in which we operate;
- impacts from tariffs, trade sanctions, export controls or other trade barriers, including export control restrictions and licensing requirements for exports to China;
- impacts resulting from the conflict between Israel and Hamas and other countries and groups in the Middle East, including impacts from changes to diplomatic relations and trade policy between the United States and other countries resulting from the conflict;
- impacts from changes to diplomatic relations and trade policy between the United States and Russia or between the United States and other countries that may support Russia or take similar actions due to the conflict between Russia and Ukraine;
- constrained credit and liquidity due to disruptions in the global economy and financial markets, which may limit or delay availability of credit under our existing or new credit facilities, or which may limit our ability to obtain credit or financing on acceptable terms or at all;
- our ability to timely recruit and retain key personnel in a highly competitive labor market, including potential financial impacts of wage inflation and potential impacts due to the proposed transaction with Synopsys;
- our ability to protect our proprietary technology; cybersecurity threats or other security breaches, including in relation to breaches occurring through our products and an increased level of our activity that is occurring from remote global off-site locations; and disclosure or misuse of employee or customer data whether as a result of a cybersecurity incident or otherwise;
- volatility in our revenue due to the timing, duration and value of multi-year subscription lease contracts; and our reliance on high renewal rates for annual subscription lease and maintenance contracts;
- declines in our customers’ businesses resulting in adverse changes in procurement patterns; disruptions in accounts receivable and cash flow due to customers’ liquidity challenges and commercial deterioration; uncertainties regarding demand for our products and services in the future and our customers’ acceptance of new products; delays or declines in anticipated sales due to reduced or altered sales and marketing interactions with customers; and potential variations in our sales forecast compared to actual sales;
- our ability and our channel partners’ ability to comply with laws and regulations in relevant jurisdictions; and the outcome of contingencies, including legal proceedings, government or regulatory investigations and tax audit cases;
- uncertainty regarding income tax estimates in the jurisdictions in which we operate; and the effect of changes in tax laws and regulations in the jurisdictions in which we operate;
- the quality of our products, including the strength of features, functionality and integrated multiphysics capabilities; our ability to develop and market new products to address the industry’s rapidly changing technology, including the use of artificial intelligence and machine learning in our products as well as the products of our competitors; failures or errors in our products and services; and increased pricing pressure as a result of the competitive environment in which we operate;
- investments in complementary companies, products, services and technologies; our ability to complete and successfully integrate our acquisitions and realize the financial and business benefits of such transactions; and the impact indebtedness incurred in connection with any acquisition could have on our operations;
- investments in global sales and marketing organizations and global business infrastructure, and dependence on our channel partners for the distribution of our products;
- current and potential future impacts of any global health crisis, natural disaster or catastrophe; the actions taken to address these events by our customers, our suppliers, and regulatory authorities; the resulting effects on our business, the global economy and our consolidated financial statements; and other public health and safety risks and related government actions or mandates;
- operational disruptions generally or specifically in connection with transitions to and from remote work environments; and the failure of our technological infrastructure or those of the service providers upon whom we rely including for infrastructure and cloud services;
- our intention to repatriate previously taxed earnings and to reinvest all other earnings of our non-U.S. subsidiaries;
- plans for future capital spending and the extent of corporate benefits from such spending; and higher than anticipated costs for research and development or a slowdown in our research and development activities;
- our ability to execute on our strategies related to environmental, social and governance matters, and meet evolving and varied expectations, including as a result of evolving regulatory and other standards, processes and assumptions, the pace of scientific and technological developments, increased costs and the availability of requisite financing, and changes in carbon markets; and
- other risks and uncertainties described in our reports filed from time to time with the Securities and Exchange Commission (the SEC).
Ansys and any and all ANSYS, Inc. brand, product, service and feature names, logos and slogans are registered trademarks or trademarks of ANSYS, Inc. or its subsidiaries in the United States or other countries. All other brand, product, service and feature names or trademarks are the property of their respective owners.
Visit https://investors.ansys.com for more information.
ANSS-F
Photos accompanying this announcement are available at
https://www.globenewswire.com/NewsRoom/AttachmentNg/555457d0-68c2-4e39-9654-7433c0575e9e
https://www.globenewswire.com/NewsRoom/AttachmentNg/f9600ece-a84c-4586-bb8a-98965ce32a1c
https://www.globenewswire.com/NewsRoom/AttachmentNg/131c8a8b-e47c-4724-bdab-f0846535f0df