Thursday, February 19, 2026
  • About Web3Wire
  • Web3Wire NFTs
  • .w3w TLD
  • $W3W Token
  • Web3Wire DAO
  • Media Network
  • RSS Feed
  • Contact Us
Web3Wire
No Result
View All Result
  • Home
  • Web3
    • Latest
    • AI
    • Business
    • Blockchain
    • Cryptocurrencies
    • Decentralized Finance
    • Metaverse
    • Non-Fungible Token
    • Press Release
  • Technology
    • Consumer Tech
    • Digital Fashion
    • Editor’s Choice
    • Guides
    • Stories
  • Coins
    • Top 10 Coins
    • Top 50 Coins
    • Top 100 Coins
    • All Coins
  • Exchanges
    • Top 10 Crypto Exchanges
    • Top 50 Crypto Exchanges
    • Top 100 Crypto Exchanges
    • All Crypto Exchanges
  • Stocks
    • Blockchain Stocks
    • NFT Stocks
    • Metaverse Stocks
    • Artificial Intelligence Stocks
  • Events
  • News
    • Latest Crypto News
    • Latest DeFi News
    • Latest Web3 News
No Result
View All Result
Web3Wire
No Result
View All Result
Home Press Release GlobeNewswire

Annual TomTom Traffic Index: U.S. Ranks Among World’s Least Congested Countries Despite Gridlocked Cities

January 21, 2026
in GlobeNewswire, Web3
Reading Time: 13 mins read
5
SHARES
244
VIEWS
Share on TwitterShare on LinkedInShare on Facebook

Annual TomTom Traffic Index: U.S. Ranks Among World’s Least Congested Countries Despite Gridlocked Cities

  • Los Angeles Tops Congestion List in U.S., New York Remains America’s Slowest City
  • Access the full report here: http://www.tomtom.com/Traffic–Index 

AMSTERDAM, Netherlands, Jan. 21, 2026 (GLOBE NEWSWIRE) — TomTom (TOM2), the specialist in mapping and location technology, today releases the 15th edition of the TomTom Traffic Index, an annual analysis of global traffic trends and commuting behavior.

Based on mobility data in the year 2025, the TomTom Traffic Index measures congestion levels, average speeds and travel times per mile across the global road network*. The insights enable governments, businesses, media and drivers to better understand how traffic behavior is evolving and the impact of people and goods moving throughout the day.

Global Congestion Continues to Rise

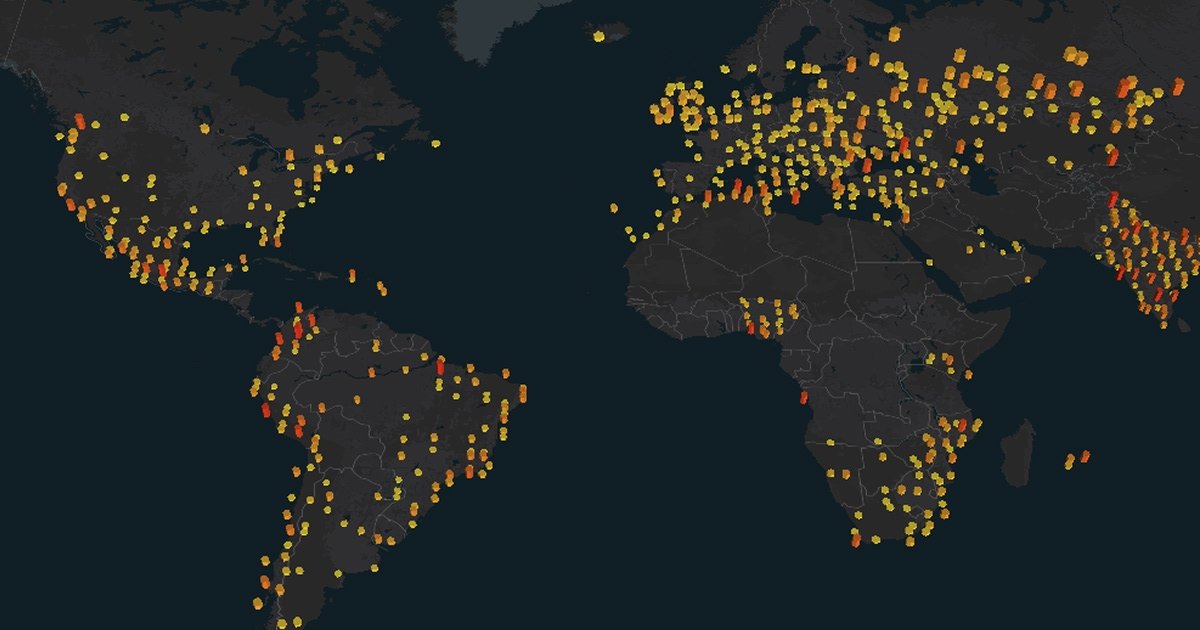
For the first time, TomTom calculated global congestion levels by aggregating driving speeds over more than 2.2 trillion miles (3.6T km) driven worldwide. The results confirm a clear upward trend: global congestion has increased by 5 percentage points, rising from 20% to 25%.

Beyond driver frustration, increased congestion has serious societal implications. Rising levels of congestion globally lead to more emissions, higher fuel consumption, reduced productivity, and growing pressure on urban infrastructure. While traffic can be an indicator of economic boon, it can also hamper economies in and of itself.

U.S. Among Least Congested Countries in World

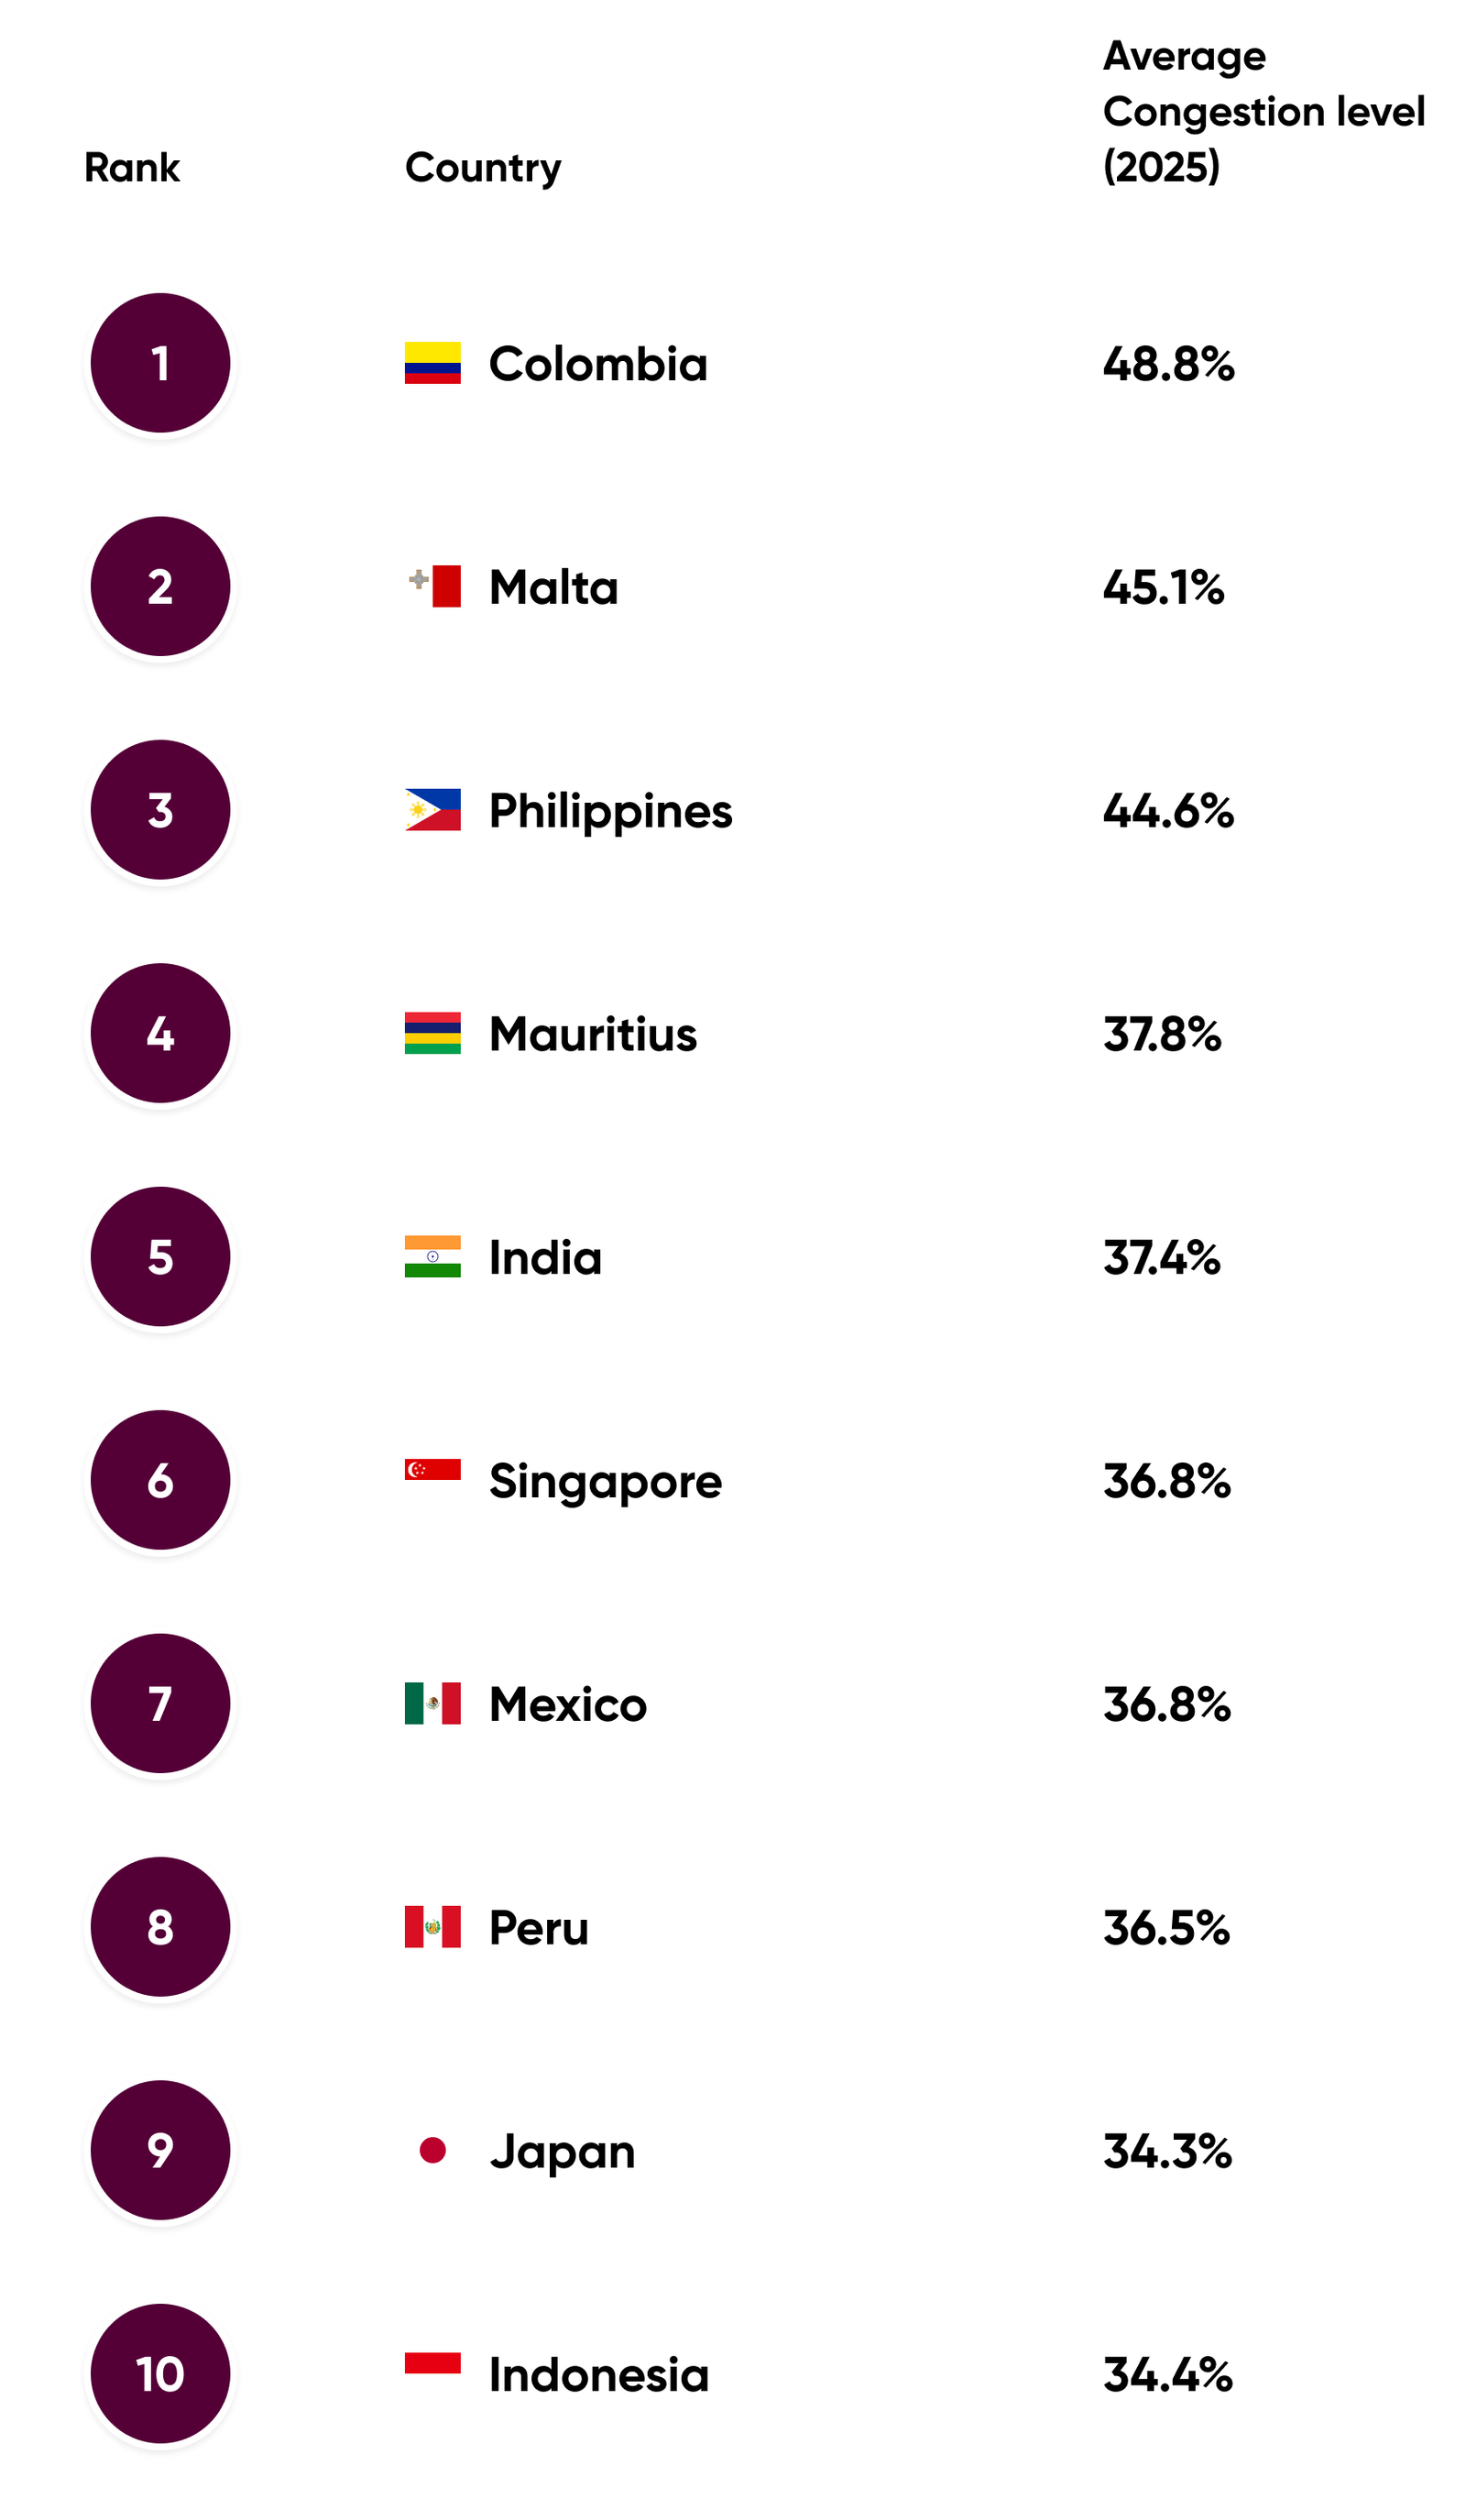
Despite having several large cities known for extreme traffic, the United States ranks among the least congested countries overall. In 2025, the U.S. placed 54th globally, with an average congestion level of 19%. By comparison, Colombia ranked 1st with an average congestion level of nearly 50%, Japan ranked 9th at 34%, the United Kingdom 23rd at 27%, and France 48th at 20%. The relatively low national congestion level reflects the scale and capacity of the U.S. road network and faster average travel speeds, and also the population density and urbanization of other countries.

Top 10 countries with the highest congestion levels

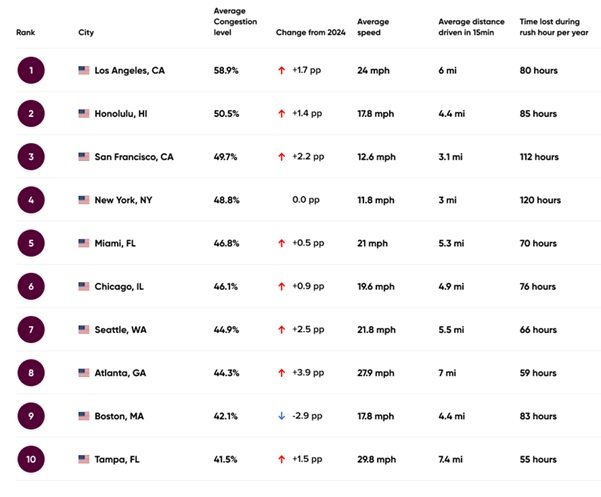
Los Angeles Tops Congestion List, New York Remains America’s Slowest City

U.S. Among Least Congested Countries in World

With nearly a 60% average congestion level, Los Angeles ranked as the most congested city in the U.S., followed by Honolulu, and San Francisco. Out of the top 10, Atlanta had the largest increase of four percentage points, while New York City stayed flat and Boston declined by three points. Overall, Americans experienced a four-point increase in traffic congestion compared to 2025.

New York remained the slowest overall city in the U.S. for a second year in a row, followed closely by San Francisco and distantly by Philadelphia and Honolulu. Based on a 6-mile commute driven during morning and evening peak hours, New Yorkers lost 120 hours to peak hour traffic in 2025, while Angelenos lost 80 hours. For comparison, drivers in Lima, Peru, in the most congested city in the world, lost nearly 188 hours in traffic.

Top 10 U.S. Cities with the Highest Congestion Levels

tbd

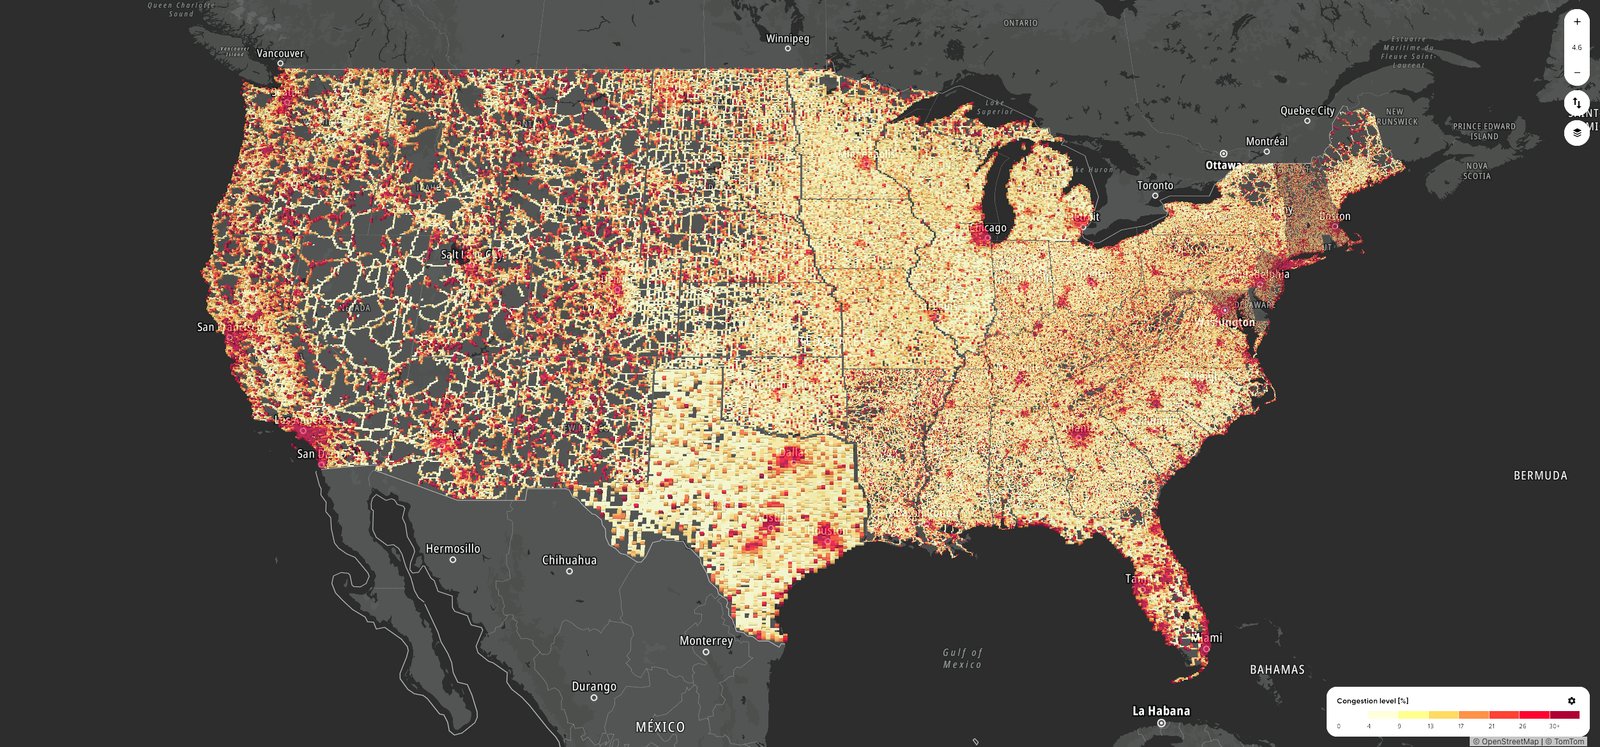
In 2025, commuting in the U.S. is no longer just about how many people are on the road – it’s about when they travel, where congestion concentrates, and how resilient the system is. New policies are reshaping traffic patterns in major cities, work-from-home norms continue to stretch and redistribute the traditional rush hour, and climate-driven disasters are increasingly testing the reliability of road networks.

Congestion Pricing Is Delivering Fewer Delays, Safer Streets

Although New York City’s overall congestion level remained flat compared to 2024, the first year of congestion pricing delivered clear, data-backed improvements on its busiest travel corridors. Major roads saw congestion fall by four percentage points year over year, with the most dramatic declines in Brooklyn (10 points) and Jersey City (eight points), though Upper Manhattan experienced a six-point increase. Peak-period traffic improved in late-morning (six points) and afternoon (nine points), improving bus efficiency entering Manhattan. Overall bridge performance improved citywide, with congestion dropping four points, led by the Williamsburg Bridge (22-point improvement), Manhattan Bridge (11 points), and Lincoln Tunnel (eight points). Weekly patterns also emerged, with Thursday ranking as the most congested day (41%), while weekends remained far smoother at 24–25%.

Local and secondary streets saw far smaller shifts, with congestion and average speeds remaining largely unchanged. However, New York City DOT reported safety outcomes within the congestion zone improved significantly: crashes dropped 14%, injuries fell 15%, and pedestrian fatalities reached their lowest levels since 2018. These findings suggest that while some traffic redistributed to local roads, the overall effect of congestion pricing has been strongly positive on the city’s core mobility network, improving performance on critical access routes and supporting early gains in transit ridership.

Rush Hour No Longer Has an Hour

Commuting in 2025 showed a clear reshaping of when people travel, even as overall congestion nearly returned to 2019 levels. Morning traffic shifted from a 7-9am peak to a more diffused pattern, with slightly lower congestion at 7–8am and a spillover into late morning. Mid-day and early-afternoon traffic (11am–3pm) is measurably higher than in 2019, pointing to more errand-running, flexible schedules, and hybrid work routines that spread demand outside traditional commute windows. Evening commuting patterns changed even more: instead of a sharp 5pm spike, congestion built earlier (3–4pm) and remained elevated through 6pm, resulting in overall slower PM speeds despite the flatter, more spread-out peak.

These shifts are even stronger when viewed through day-of-week and city-type lenses. By 2025, Tuesday–Thursday became the dominant commute days, while Monday nearly recovered to pre-COVID levels and Friday volumes fell – a strong indication of hybrid schedules clustering office days midweek. Tech-centric metros such as San Francisco, San Jose, Seattle, Austin, Boston, and Denver continue to lag 2019 delays and displayed the most pronounced midweek surges. In contrast, most other larger metros have surpassed 2019 congestion, especially during the evening commute period. Together, the data suggests that hybrid/remote work did not reduce commuting overall in 2025 but has fundamentally redistributed it – concentrating trips on select days and stretching the once-defined “rush hour” across a wider time period.

Extreme Weather Is Reshaping Road Performance and Reliability

Climate-related disasters are increasingly degrading U.S. road networks, with USDOT projecting that up to $20 billion per year will be spent on paved-road damage by 2030 due to heat, heavy rain, and coastal flooding. Weather also accounts for 15% of all non-recurring congestion, second only to traffic incidents. Recent natural disasters illustrate how quickly road conditions can unravel. The December 2025 Christmas floods in San Bernardino slowed highway speeds by 19% in Wrightwood and cut local road speeds by 22% in Lytle Creek. The December atmospheric river in the Pacific Northwest closed more than 300 roads and pushed congestion up 19% in parts of Seattle. It also created extreme chokepoints, most notably a 400% spike in congestion on I-5 during the SR-167 closure.

The transportation impacts extended well beyond the disaster periods. The July 2025 Texas Hill Country floods produced a 23% surge in congestion across all roads, with local streets hitting 51%. Even after two months, average speeds were still 7% below the prior year, highlighting the lasting effects of damaged infrastructure and slow recovery. Taken together, these events indicate that not only natural disasters cause immediate slowdowns but also drive prolonged detours, reduced travel speeds, and rising economic costs. It also underscores the growing urgency for resilient corridor design and adaptive routing strategies.

What Happens Next

Cities are dynamic ecosystems of movement, interaction, and innovation. Roads help facilitate movement within this ecosystem, whether it’s moving people, packages, or pizza. As cities grow denser and interconnected, residents will continue to face increasing strain from congestion, pollution, and inefficient transportation networks.

“As cities grow and adapt, we must address the multifaceted challenges that lead to increasing traffic congestion,” said Ralf-Peter Schäfer, Vice President for Traffic and Travel Information, TomTom. “The upward trend we see necessitates urgent action in smarter mobility planning, investments in public and shared transport, improved traffic management technologies, and coordinated policies. Our traffic data enables urban planners and policymakers to better understand these interconnected issues and make well-informed decisions that ensure cities remain livable, efficient, and sustainable in the face of growing congestion.”

For 15 years, the TomTom Traffic Index has provided a global view of mobility trends shaped by urban policies and driver behavior. The Traffic Index also serves as a critical benchmark for Departments of Transportation (DOTs), road authorities, and city planners to make cities smarter, more efficient, and more sustainable.

About the TomTom Traffic Index

The 15th edition of the TomTom Traffic Index is our most robust and complete analysis ever. The Index benchmarks cities on their congestion levels, travel times and speeds, based on worldwide trip data spanning more than 3.65 trillion km, providing access to traffic information city by city. TomTom Traffic Index insights help state, regional and federal governments, DoTs, city planners and decision makers tackle traffic challenges and develop future-shaping strategies.

For the first time, all data from the cities included in the Traffic Index can now be accessed through the new TomTom Area Analytics tool, launched last month. Users can select any city or define a custom area and analyze traffic across specific days, months, or years, with detailed hourly breakdowns for deeper insight into mobility trends. From neighborhoods to entire countries, the tool quickly delivers detailed insights into congestion levels, travel speeds, and free-flow conditions, helping users better understand how mobility evolves over time and providing one of the world’s most comprehensive views of road and traffic performance.

Download the full report here.

*Note to editors: Data covers all countries where reliable traffic information is available. Certain territories, including countries in active conflict situations and regions such as China where data access is restricted, are excluded for ethical or availability reasons.

About TomTom:

Billions of data points. Millions of sources. Hundreds of communities.

We are the mapmaker bringing it all together to build the world’s smartest map. We provide location data and technology to drivers, carmakers, businesses, and developers. Our application-ready maps, routing, real-time traffic, APIs, and SDKs enable the dreamers and doers to shape the future of mobility.

http://www.tomtom.com

For further information:

Media Relations
mediarelations@tomtom.com

Investor Relations
ir@tomtom.com

Photos accompanying this announcement are available at:

https://www.globenewswire.com/NewsRoom/AttachmentNg/66582560-fcda-4907-9676-ca33ed8a3368

https://www.globenewswire.com/NewsRoom/AttachmentNg/a4521b27-2f4e-4031-ac10-f50b68618e8a

https://www.globenewswire.com/NewsRoom/AttachmentNg/953465ef-1abb-440b-aebc-89e6bc04e63e

https://www.globenewswire.com/NewsRoom/AttachmentNg/cca407ce-eff7-4986-84c8-79219a91cdc1

About Web3Wire
Web3Wire – Information, news, press releases, events and research articles about Web3, Metaverse, Blockchain, Artificial Intelligence, Cryptocurrencies, Decentralized Finance, NFTs and Gaming.
Visit Web3Wire for Web3 News and Events, Block3Wire for the latest Blockchain news and Meta3Wire to stay updated with Metaverse News.

ShareTweet1ShareSendShare2
Previous Post

Credit Card Payments Market Research on Opportunities Challenges and Innovations Including Blockchain Security Solutions and Fintech Mergers

Next Post

FY 2025 Preliminary and Unaudited Figures Highlighting Significant Progress in the Execution of the Genesis Plan

Related Posts

High Bay LED Lighting Market Forecast to Reach USD 65.88 Billion by 2033

The Global High Bay LED Lighting Market is undergoing a significant transformation, driven by the shift from traditional lighting technologies like fluorescent and high-intensity discharge (HID) to more efficient, long-lasting LED solutions. While the user's premise about a "high opportunity of Fluorescent Lights" within this market is counterintuitive, the true...

Read moreDetails

Digital Out-of-Home (DOOH) Market Forecast to Reach USD 58 Billion by 2031

The Digital Out of Home (DOOH) market is experiencing rapid growth, with the global market projected to reach over $58 billion by 2031, growing at a compound annual growth rate (CAGR) of 11.6%. Amidst this expansion, the personal care and household goods sector is emerging as a significant and high-potential...

Read moreDetails

Cloud Gaming Market Forecast to Reach USD 24.58 Billion by 2033

The global cloud gaming market is undergoing a significant transformation, with video and file streaming at the forefront of this revolution. Valued at USD 2.04 billion in 2023, the market is poised for an explosive expansion, projected to reach USD 24.58 billion by 2033, reflecting a staggering 51.74% Compound Annual...

Read moreDetails

3D Scanning Market Forecast to Reach USD 7 Billion by 2034

The 3D scanning market is experiencing rapid growth, with the global market size projected to reach over $7 billion by 2034. While laser scanners have historically held a dominant market share, optical scanners are emerging as a high-opportunity segment. Their rapid growth is fueled by their affordability, user-friendliness, and ability...

Read moreDetails

Web Hosting Services Market Forecast to Reach USD 320.42 Billion by 2033

The web hosting services market is undergoing a significant transformation, driven by the expanding digital landscape. As businesses and individuals increasingly establish an online presence, the demand for robust and reliable hosting solutions has surged. The market is projected to reach an impressive $320.42 billion by 2033, a substantial increase...

Read moreDetails

Visualization and 3D Rendering Software Market Forecast to Reach USD 13.65 Billion by 2033

The Visualization and 3D Rendering Software Market is on a trajectory of significant growth, driven by a global demand for high-quality visual content. The market, valued at USD 2.65 billion in 2023, is projected to soar to USD 13.65 billion by 2033, a remarkable Compound Annual Growth Rate (CAGR) of...

Read moreDetails

The Future of Influencer Content: How Creators Scale Production with AI

The Creator Production CrisisEvery content creator faces the same constraint: more ideas than production capacity.A successful YouTube content creator has 100 video ideas. They can produce 4 per month. A TikTok creator could post 10 times daily but manages 3-4. An Instagram creator wants themed content series but settles for...

Read moreDetails

Kyndryl Shareholder Alert: ClaimsFiler Reminds Investors With Losses In Excess Of $100,000 Of Lead Plaintiff Deadline In Class Action Lawsuit Against Kyndryl Holdings, Inc. – KD

NEW ORLEANS, Feb. 18, 2026 (GLOBE NEWSWIRE) -- ClaimsFiler, a FREE shareholder information service, reminds investors that they have until April 13, 2026 to file lead plaintiff applications in a securities class action lawsuit against Kyndryl Holdings, Inc. (“Kyndryl” or the “Company”) (NYSE: KD), if they purchased or otherwise acquired...

Read moreDetails

Ultragenyx Shareholder Alert: ClaimsFiler Reminds Investors With Losses In Excess Of $100,000 Of Lead Plaintiff Deadline In Class Action Lawsuit Against Ultragenyx Pharmaceutical Inc. – RARE

NEW ORLEANS, Feb. 18, 2026 (GLOBE NEWSWIRE) -- ClaimsFiler, a FREE shareholder information service, reminds investors that they have until April 6, 2026 to file lead plaintiff applications in a securities class action lawsuit against Ultragenyx Pharmaceutical Inc. (“Ultragenyx” or the “Company”) (NasdaqGS: RARE), if they purchased or otherwise acquired...

Read moreDetails

AI Won’t Replace Junior Developers, Reshapes Coding Future

If you are a computer science student, a recent bootcamp graduate, or a junior developer just starting your first job, you have probably felt the knot in your stomach. It's that sinking feeling you get when you watch a demo of the latest AI model. You watch it solve a...

Read moreDetails
Web3Wire NFTs - The Web3 Collective

Web3Wire, $W3W Token and .w3w tld Whitepaper

Web3Wire, $W3W Token and .w3w tld Whitepaper

Claim your space in Web3 with .w3w Domain!

Web3Wire

Trending on Web3Wire

  • Best Crypto Investing App 2026 Announced

    7 shares
    Share 3 Tweet 2
  • Top Cross-Chain DeFi Solutions to Watch by 2025

    80 shares
    Share 32 Tweet 20
  • Unifying Blockchain Ecosystems: 2024 Guide to Cross-Chain Interoperability

    151 shares
    Share 60 Tweet 38
  • Discover 2025’s Top 5 Promising Low-Cap Crypto Gems

    91 shares
    Share 36 Tweet 23
  • Civic and Rentality Transform Web3 Car Rentals with Blockchain Technology

    6 shares
    Share 2 Tweet 2
Join our Web3Wire Community!

Our newsletters are only twice a month, reaching around 10000+ Blockchain Companies, 800 Web3 VCs, 600 Blockchain Journalists and Media Houses.


* We wont pass your details on to anyone else and we hate spam as much as you do. By clicking the signup button you agree to our Terms of Use and Privacy Policy.

Web3Wire Podcasts

Upcoming Events

There are currently no events.

Latest on Web3Wire

  • High Bay LED Lighting Market Forecast to Reach USD 65.88 Billion by 2033
  • Digital Out-of-Home (DOOH) Market Forecast to Reach USD 58 Billion by 2031
  • Cloud Gaming Market Forecast to Reach USD 24.58 Billion by 2033
  • 3D Scanning Market Forecast to Reach USD 7 Billion by 2034
  • Web Hosting Services Market Forecast to Reach USD 320.42 Billion by 2033

RSS Latest on Block3Wire

  • Covo Finance: Revolutionary Crypto Leverage Trading Platform
  • WorldStrides and HEX Announce Partnership to Offer High School and University Students Innovative Courses Designed to Improve Their Outlook in the Digital Age
  • Cathedra Bitcoin Announces Leasing of 2.5-MW Bitcoin Mining Facility
  • Global Web3 Payments Leader, Banxa, Announces Integration With Metis to Usher In Next Wave of Cryptocurrency Users
  • Dexalot Launches First Hybrid DeFi Subnet on Avalanche

RSS Latest on Meta3Wire

  • Thumbtack Honored as a 2023 Transform Awards Winner
  • Accenture Invests in Looking Glass to Accelerate Shift from 2D to 3D
  • MetatronAI.com Unveils Revolutionary AI-Chat Features and Interface Upgrades
  • Purely.website – Disruptive new platform combats rising web hosting costs
  • WEMADE and Metagravity Sign Strategic Alliance MOU to Collaborate on Blockchain Games for the Metaverse
Web3Wire

Web3Wire is your go-to source for the latest insights and updates in Web3, Metaverse, Blockchain, AI, Cryptocurrencies, DeFi, NFTs, and Gaming. We provide comprehensive coverage through news, press releases, event updates, and research articles, keeping you informed about the rapidly evolving digital world.

  • About Web3Wire
  • Web3Wire NFTs – The Web3 Collective
  • .w3w TLD
  • $W3W Token
  • Web3Wire DAO
  • Event Partners
  • Community Partners
  • Our Media Network
  • Media Kit
  • RSS Feeds
  • Contact Us

Whitepaper | Tokenomics

Crypto Coins

  • Top 10 Coins
  • Top 50 Coins
  • Top 100 Coins
  • All Coins – Marketcap
  • Crypto Coins Heatmap

Crypto Exchanges

  • Top 10 Exchanges
  • Top 50 Exchanges
  • Top 100 Exchanges
  • All Crypto Exchanges

Crypto Stocks

  • Blockchain Stocks
  • NFT Stocks
  • Metaverse Stocks
  • Artificial Intelligence Stocks

Media Portfolio: Block3Wire | Meta3Wire

Web3 Resources

  • Top Web3 and Crypto Youtube Channels
  • Latest Crypto News
  • Latest DeFi News
  • Latest Web3 News

Blockchain Resources

  • Blockchain and Web3 Resources
  • Decentralized Finance (DeFi) – Research Reports
  • All Crypto Whitepapers

Metaverse Resources

  • AR VR and Metaverse Resources
  • Metaverse Courses
Claim your space in Web3 with .w3w!
Top 50 Web3 Blogs and Websites
Web3Wire Podcast on Spotify Web3Wire Podcast on Amazon Music 
Web3Wire - Web3 and Blockchain - News, Events and Press Releases | Product Hunt
Web3Wire on Google News
  • Privacy Policy
  • Terms of Use
  • Disclaimer
  • Sitemap
  • For Search Engines
  • Crypto Sitemap
  • Exchanges Sitemap

© 2024 Web3Wire. We strongly recommend our readers to DYOR, before investing in any cryptocurrencies, blockchain projects, or ICOs, particularly those that guarantee profits.

Welcome Back!

Login to your account below

Forgotten Password?

Retrieve your password

Please enter your username or email address to reset your password.

Log In

Add New Playlist

No Result
View All Result
  • Coins
    • Top 10 Cryptocurrencies
    • Top 50 Cryptocurrencies
    • Top 100 Cryptocurrencies
    • All Coins
  • Exchanges
    • Top 10 Cryptocurrency Exchanges
    • Top 50 Cryptocurrency Exchanges
    • Top 100 Cryptocurrency Exchanges
    • All Crypto Exchanges
  • Stocks
    • Blockchain Stocks
    • NFT Stocks
    • Metaverse Stocks
    • Artificial Intelligence Stocks

© 2024 Web3Wire. We strongly recommend our readers to DYOR, before investing in any cryptocurrencies, blockchain projects, or ICOs, particularly those that guarantee profits.

This website uses cookies. By continuing to use this website you are giving consent to cookies being used. Visit our Privacy and Cookie Policy.